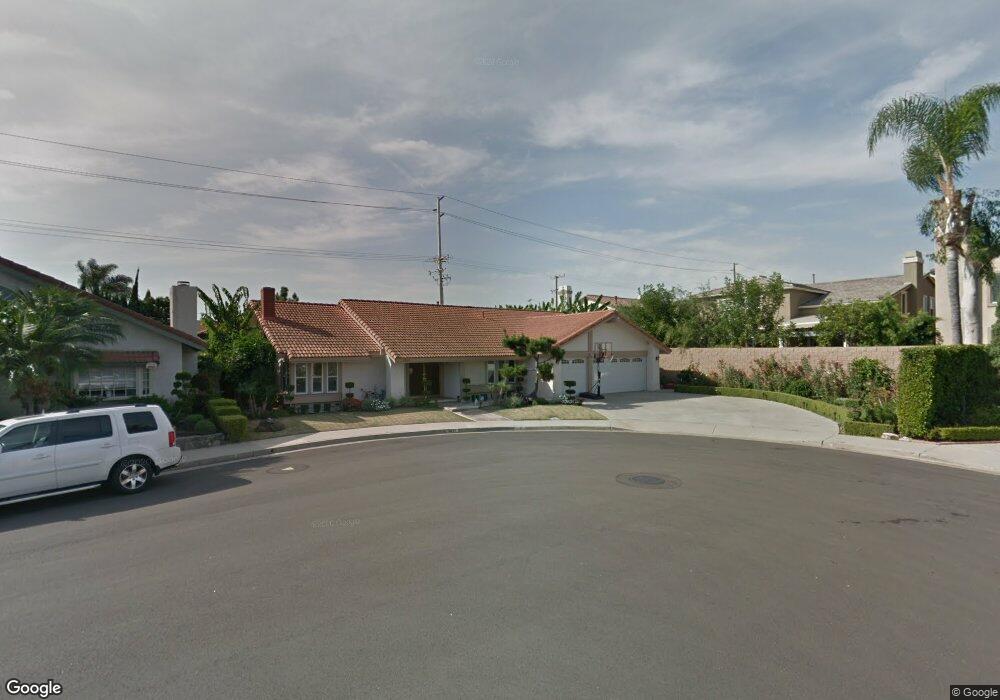
18141 Devonwood Cir Fountain Valley, CA 92708
Estimated Value: $1,650,000 - $1,914,019
4
Beds
3
Baths
2,819
Sq Ft
$626/Sq Ft
Est. Value
About This Home
This home is located at 18141 Devonwood Cir, Fountain Valley, CA 92708 and is currently estimated at $1,765,755, approximately $626 per square foot. 18141 Devonwood Cir is a home located in Orange County with nearby schools including Courreges (Roch) Elementary School, Fulton (Harry C.) Middle School, and Fountain Valley High School.
Ownership History
Date
Name
Owned For
Owner Type
Purchase Details
Closed on
Apr 22, 2014
Sold by
Nguyen Tricia My Xuyen and Nguyen Tricia M
Bought by
Nguyen Tracia My Xuyen and Tricia My Xuyen Nguyen Revocable Living
Current Estimated Value
Purchase Details
Closed on
Mar 7, 2013
Sold by
Le Truman T
Bought by
Nguyen Tricia M
Purchase Details
Closed on
Sep 21, 2009
Sold by
Mardini Mounir Daoud
Bought by
Nguyen Tricia M and Le Truman T
Home Financials for this Owner
Home Financials are based on the most recent Mortgage that was taken out on this home.
Original Mortgage
$330,000
Outstanding Balance
$215,270
Interest Rate
5.14%
Mortgage Type
New Conventional
Estimated Equity
$1,550,485
Purchase Details
Closed on
Aug 21, 2009
Sold by
Mardini Marie Rose
Bought by
Mardini Mounir Daoud
Home Financials for this Owner
Home Financials are based on the most recent Mortgage that was taken out on this home.
Original Mortgage
$330,000
Outstanding Balance
$215,270
Interest Rate
5.14%
Mortgage Type
New Conventional
Estimated Equity
$1,550,485
Create a Home Valuation Report for This Property
The Home Valuation Report is an in-depth analysis detailing your home's value as well as a comparison with similar homes in the area
Home Values in the Area
Average Home Value in this Area
Purchase History
| Date | Buyer | Sale Price | Title Company |
|---|---|---|---|
| Nguyen Tracia My Xuyen | -- | None Available | |
| Nguyen Tricia M | -- | None Available | |
| Nguyen Tricia M | $685,000 | Lawyers Title | |
| Mardini Mounir Daoud | -- | Lawyers Title |
Source: Public Records
Mortgage History
| Date | Status | Borrower | Loan Amount |
|---|---|---|---|
| Open | Nguyen Tricia M | $330,000 |
Source: Public Records
Tax History Compared to Growth
Tax History
| Year | Tax Paid | Tax Assessment Tax Assessment Total Assessment is a certain percentage of the fair market value that is determined by local assessors to be the total taxable value of land and additions on the property. | Land | Improvement |
|---|---|---|---|---|
| 2025 | $9,659 | $884,209 | $603,928 | $280,281 |
| 2024 | $9,659 | $866,872 | $592,086 | $274,786 |
| 2023 | $9,433 | $849,875 | $580,476 | $269,399 |
| 2022 | $9,297 | $833,211 | $569,094 | $264,117 |
| 2021 | $9,116 | $816,874 | $557,935 | $258,939 |
| 2020 | $9,063 | $808,498 | $552,214 | $256,284 |
| 2019 | $8,874 | $792,646 | $541,387 | $251,259 |
| 2018 | $8,702 | $777,104 | $530,771 | $246,333 |
| 2017 | $8,564 | $761,867 | $520,364 | $241,503 |
| 2016 | $8,190 | $746,929 | $510,161 | $236,768 |
| 2015 | $8,064 | $735,710 | $502,498 | $233,212 |
| 2014 | $7,905 | $721,299 | $492,655 | $228,644 |
Source: Public Records
Map
Nearby Homes
- 18241 Devonwood Cir
- 18162 Santa Adela Cir
- 139 Laburnum Ln
- 106 Osprey Ln
- 18417 Mount Kristina St
- 201 Road Runner Ln
- 120 Laburnam Ln
- 112 Parrot Ln
- 134 Pecan Ln
- 126 Pecan Ln
- 108 Pigeon Ln
- 209 Road Runner Ln
- 127 Sumac Ln
- 110 Sumac Ln
- 120 Sumac Ln
- 109 Pigeon Ln Unit 109
- 109 Pigeon Ln
- 202 Pigeon Ln
- 122 Hornbeam Ln
- 17807 Joshua Cir
- 18110 Magnolia St
- 18151 Devonwood Cir
- 9034 Lemongrass Ct
- 18161 Devonwood Cir
- 9032 Lemongrass Ct
- 9042 Lemongrass Ct
- 18140 Devonwood Cir
- 18171 Devonwood Cir
- 9044 Lemongrass Ct
- 18150 Devonwood Cir
- 8985 Rhine River Ave
- 18160 Devonwood Cir
- 18181 Devonwood Cir
- 9052 Lemongrass Ct
- 18170 Devonwood Cir
- 8975 Rhine River Ave
- 18191 Devonwood Cir
- 18180 Devonwood Cir
- 9033 Lemongrass Ct
- 9039 Lemongrass Ct