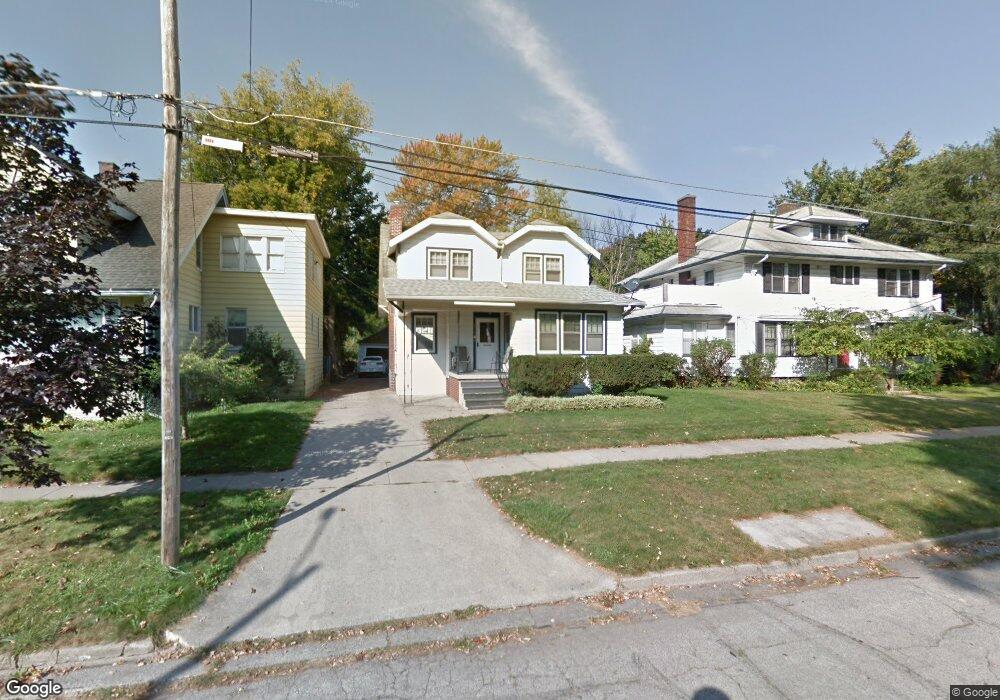
1815 Stark St Saginaw, MI 48602
Covenant NeighborhoodEstimated Value: $76,674 - $87,000
4
Beds
2
Baths
1,925
Sq Ft
$43/Sq Ft
Est. Value
About This Home
This home is located at 1815 Stark St, Saginaw, MI 48602 and is currently estimated at $83,419, approximately $43 per square foot. 1815 Stark St is a home located in Saginaw County with nearby schools including Stone School, Thompson Middle School, and Arthur Hill High School.
Ownership History
Date
Name
Owned For
Owner Type
Purchase Details
Closed on
Mar 20, 2024
Sold by
Miller Julie M
Bought by
Miller Julie M and Ursuy Daniel G
Current Estimated Value
Purchase Details
Closed on
Aug 26, 2020
Sold by
Smith Gregory J
Bought by
Miller Julie
Purchase Details
Closed on
Jul 3, 2018
Sold by
Smith Gregory J
Bought by
Smith Gregory J and Miller Julie
Purchase Details
Closed on
Sep 9, 2016
Sold by
Smith Joseph F and Smith Marianne
Bought by
Smith Gregory J
Purchase Details
Closed on
Aug 1, 2002
Sold by
Smith Marianne and Smith Julie M
Bought by
Smith
Purchase Details
Closed on
Aug 31, 2000
Sold by
Standard Federal Bank
Bought by
Smith Marianne
Purchase Details
Closed on
Mar 4, 1992
Sold by
Smith Marianne
Bought by
Smith Marianne and Julie Marie
Purchase Details
Closed on
Jun 25, 1988
Sold by
Parshall Joan W
Bought by
Bankers Mortgage Corporation
Purchase Details
Closed on
May 25, 1985
Sold by
Parshall Dorr L and Parshall Joan
Bought by
Bankers Mortgage Corpoation
Create a Home Valuation Report for This Property
The Home Valuation Report is an in-depth analysis detailing your home's value as well as a comparison with similar homes in the area
Home Values in the Area
Average Home Value in this Area
Purchase History
| Date | Buyer | Sale Price | Title Company |
|---|---|---|---|
| Miller Julie M | -- | None Listed On Document | |
| Miller Julie | -- | None Available | |
| Smith Gregory J | -- | -- | |
| Smith Gregory J | -- | None Available | |
| Smith | -- | -- | |
| Smith Marianne | -- | -- | |
| Smith Marianne | $16,800 | -- | |
| Smith Marianne | -- | -- | |
| Bankers Mortgage Corporation | $5,600 | -- | |
| Bankers Mortgage Corpoation | $5,600 | -- |
Source: Public Records
Tax History Compared to Growth
Tax History
| Year | Tax Paid | Tax Assessment Tax Assessment Total Assessment is a certain percentage of the fair market value that is determined by local assessors to be the total taxable value of land and additions on the property. | Land | Improvement |
|---|---|---|---|---|
| 2025 | $1,802 | $35,800 | $0 | $0 |
| 2024 | $1,432 | $33,200 | $0 | $0 |
| 2023 | $1,388 | $33,200 | $0 | $0 |
| 2022 | $1,416 | $30,400 | $0 | $0 |
| 2021 | $1,562 | $27,000 | $0 | $0 |
| 2020 | $1,384 | $26,400 | $0 | $0 |
| 2019 | $1,205 | $23,300 | $700 | $22,600 |
| 2018 | $1,244 | $23,668 | $0 | $0 |
| 2017 | $1,422 | $22,000 | $0 | $0 |
| 2016 | $1,184 | $21,333 | $0 | $0 |
| 2014 | -- | $22,769 | $0 | $22,050 |
| 2013 | -- | $23,774 | $0 | $0 |
Source: Public Records
Map
Nearby Homes
- 1819 Stark St
- 1826 Stone St
- 815 W Genesee Ave
- 1920 Hanchett St
- 1833 N Bond St
- 1720 N Oakley St
- 2021 Benjamin St
- 2023 Schaefer St
- 2206 N Bond St
- 1818 N Woodbridge St
- 1739 N Woodbridge St
- 1608 Congress Ave
- 1634 Delaware St
- 1603 Cooper Ave
- 1827 Delaware St
- 2004 Delaware St
- 2343 N Bond St
- 1616 State St
- 2015 Delaware St
- 2104 Delaware Blvd
- 1809 Stark St
- 908 Congress Ave
- 902 Congress Ave
- 1827 Stark St
- 1814 Stark St
- 916 Congress Ave
- 1820 Stark St
- 820 Congress Ave
- 1814 Stone St
- 1835 Stark St
- 912 Congress Ave
- 920 Congress Ave
- 911 Union Ave
- 816 Congress Ave
- 1822 Stone St
- 907 Union Ave
- 915 Union Ave
- 821 Union Ave
- 815 Union Ave
- 1832 Stone St