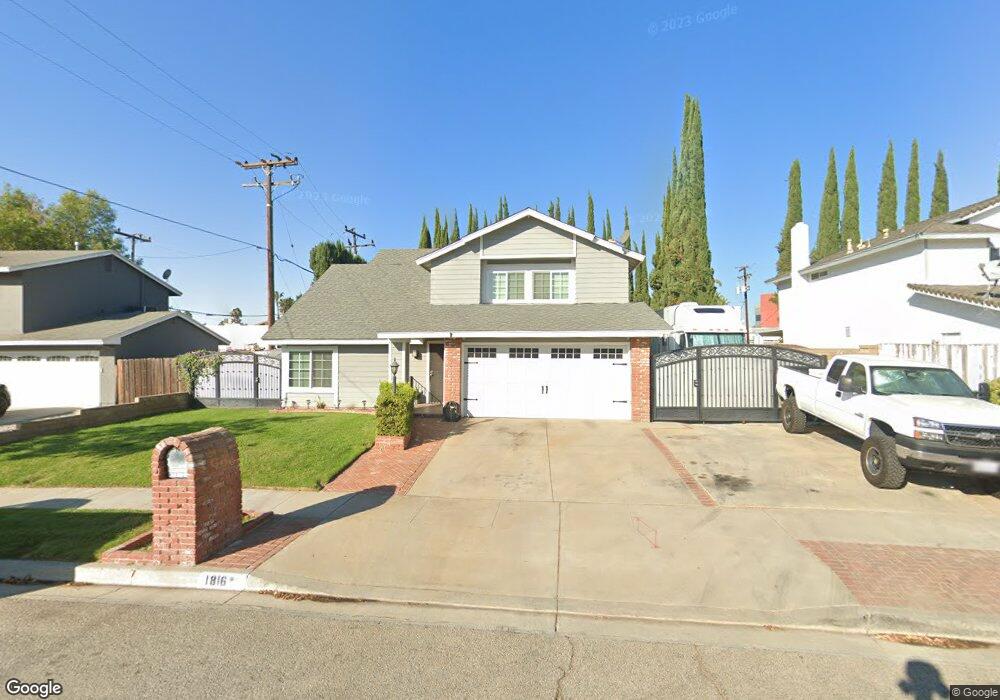
1816 Morley St Simi Valley, CA 93065
Central Simi Valley NeighborhoodEstimated Value: $830,000 - $906,000
4
Beds
3
Baths
1,927
Sq Ft
$453/Sq Ft
Est. Value
About This Home
This home is located at 1816 Morley St, Simi Valley, CA 93065 and is currently estimated at $873,107, approximately $453 per square foot. 1816 Morley St is a home located in Ventura County with nearby schools including Berylwood Elementary School, Hillside Middle School, and Royal High School.
Ownership History
Date
Name
Owned For
Owner Type
Purchase Details
Closed on
Oct 5, 2023
Sold by
Mumford Brian L and Mumford Kellie A
Bought by
Brian Lee Mumford And Kellie Anne Mumford Fam and Mumford
Current Estimated Value
Purchase Details
Closed on
Sep 5, 2000
Sold by
Michelson Albert J
Bought by
Mumford Brian L and Mumford Kellie A
Home Financials for this Owner
Home Financials are based on the most recent Mortgage that was taken out on this home.
Original Mortgage
$231,600
Interest Rate
9.6%
Create a Home Valuation Report for This Property
The Home Valuation Report is an in-depth analysis detailing your home's value as well as a comparison with similar homes in the area
Home Values in the Area
Average Home Value in this Area
Purchase History
| Date | Buyer | Sale Price | Title Company |
|---|---|---|---|
| Brian Lee Mumford And Kellie Anne Mumford Fam | -- | None Listed On Document | |
| Mumford Brian L | $289,500 | United Title Company |
Source: Public Records
Mortgage History
| Date | Status | Borrower | Loan Amount |
|---|---|---|---|
| Previous Owner | Mumford Brian L | $231,600 |
Source: Public Records
Tax History Compared to Growth
Tax History
| Year | Tax Paid | Tax Assessment Tax Assessment Total Assessment is a certain percentage of the fair market value that is determined by local assessors to be the total taxable value of land and additions on the property. | Land | Improvement |
|---|---|---|---|---|
| 2025 | $5,580 | $436,198 | $174,475 | $261,723 |
| 2024 | $5,580 | $427,646 | $171,054 | $256,592 |
| 2023 | $5,255 | $419,261 | $167,700 | $251,561 |
| 2022 | $5,228 | $411,041 | $164,412 | $246,629 |
| 2021 | $5,185 | $402,982 | $161,188 | $241,794 |
| 2020 | $5,077 | $398,851 | $159,536 | $239,315 |
| 2019 | $4,852 | $391,031 | $156,408 | $234,623 |
| 2018 | $4,808 | $383,365 | $153,342 | $230,023 |
| 2017 | $4,702 | $375,849 | $150,336 | $225,513 |
| 2016 | $4,496 | $368,481 | $147,389 | $221,092 |
| 2015 | $4,402 | $362,948 | $145,176 | $217,772 |
| 2014 | $4,339 | $355,840 | $142,333 | $213,507 |
Source: Public Records
Map
Nearby Homes
- 1932 Heywood St Unit B
- 1948 Heywood St Unit L
- 2091 Marter Ave
- 1886 Cloud Ct
- 1755 Heywood St Unit 203
- 2146 N Brower St
- 1882 Larch St
- 1740 Heywood St
- 2095 Morley St
- 2239 McDonald St
- 1876 Duncan St
- 2291 N Marter Ct
- 2266 Lansdale Ct
- 1663 Anderson St
- 2349 Knollhaven St
- 2368 Heywood St
- 1858 Sutter Ave
- 2405 Lee St
- 1529 Patricia Ave Unit 6
- 2025 Royal Ave
- 1824 Morley St
- 1786 Morley St
- 1830 Morley St
- 1760 Morley St
- 1966 Morning Glory St
- 2005 Denny St
- 1838 Morley St
- 1978 Morning Glory St
- 2017 Denny St
- 1738 Morley St
- 1844 Morley St
- 1761 Morley St
- 1990 Morning Glory St
- 2004 Denny St
- 2029 Denny St
- 1712 Morley St
- 2016 Denny St
- 1739 Morley St
- 1852 Morley St
- 2004 Morning Glory St