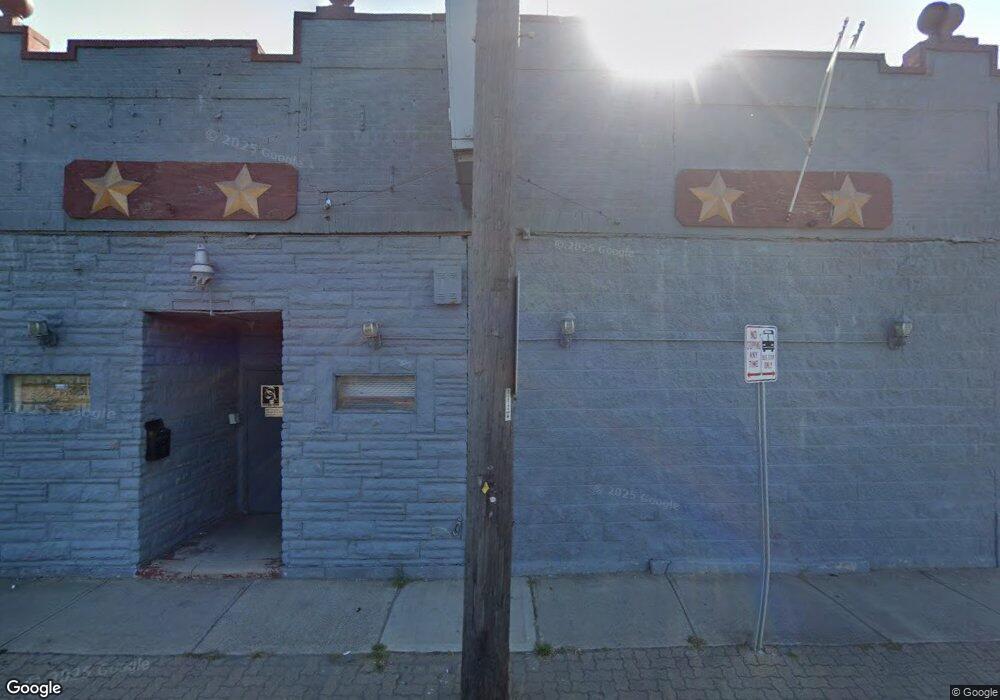
1816 Parsons Ave Columbus, OH 43207
Obetz-Lockbourne NeighborhoodEstimated Value: $87,684
--
Bed
--
Bath
3,520
Sq Ft
$25/Sq Ft
Est. Value
About This Home
This home is located at 1816 Parsons Ave, Columbus, OH 43207 and is currently priced at $87,684, approximately $24 per square foot. 1816 Parsons Ave is a home located in Franklin County with nearby schools including Lincoln Park Elementary School, South High School, and South Columbus Preparatory Academy.
Ownership History
Date
Name
Owned For
Owner Type
Purchase Details
Closed on
Jun 30, 2025
Sold by
1816 Parsons Llc
Bought by
Tack Property Holdings Llc
Current Estimated Value
Purchase Details
Closed on
Aug 18, 2023
Sold by
Equity Trust Co
Bought by
1816 Parsons Llc
Purchase Details
Closed on
Aug 10, 2023
Sold by
Equity Trust Co
Bought by
1816 Parsons Llc
Purchase Details
Closed on
Feb 25, 2021
Sold by
Kac Management Llc
Bought by
Equity Trust Company and 200418440 Ira
Purchase Details
Closed on
May 31, 2019
Sold by
Ewing Glenna Hope and Little Glenna Hope
Bought by
Kac Management Llc
Purchase Details
Closed on
Mar 5, 1997
Sold by
Holland Geraldine O
Bought by
Glenna H Little
Home Financials for this Owner
Home Financials are based on the most recent Mortgage that was taken out on this home.
Original Mortgage
$55,250
Interest Rate
7.93%
Mortgage Type
Commercial
Purchase Details
Closed on
Apr 2, 1991
Create a Home Valuation Report for This Property
The Home Valuation Report is an in-depth analysis detailing your home's value as well as a comparison with similar homes in the area
Home Values in the Area
Average Home Value in this Area
Purchase History
| Date | Buyer | Sale Price | Title Company |
|---|---|---|---|
| Tack Property Holdings Llc | $185,000 | Great American Title | |
| 1816 Parsons Llc | $80,000 | Pm Title | |
| 1816 Parsons Llc | $80,000 | Pm Title | |
| Equity Trust Company | $50,000 | Land And Mortgage Title Agcy | |
| Kac Management Llc | $74,000 | Land And Mortgage Title Agcy | |
| Glenna H Little | $65,000 | -- | |
| -- | $15,000 | -- |
Source: Public Records
Mortgage History
| Date | Status | Borrower | Loan Amount |
|---|---|---|---|
| Previous Owner | Glenna H Little | $55,250 |
Source: Public Records
Tax History Compared to Growth
Tax History
| Year | Tax Paid | Tax Assessment Tax Assessment Total Assessment is a certain percentage of the fair market value that is determined by local assessors to be the total taxable value of land and additions on the property. | Land | Improvement |
|---|---|---|---|---|
| 2024 | $6,385 | $41,860 | $8,890 | $32,970 |
| 2023 | $3,058 | $41,860 | $8,890 | $32,970 |
| 2022 | $2,455 | $32,730 | $6,510 | $26,220 |
| 2021 | $2,465 | $32,730 | $6,510 | $26,220 |
| 2020 | $2,448 | $32,730 | $6,510 | $26,220 |
| 2019 | $2,451 | $29,760 | $5,920 | $23,840 |
| 2018 | $2,353 | $29,760 | $5,920 | $23,840 |
| 2017 | $2,443 | $29,760 | $5,920 | $23,840 |
| 2016 | $2,438 | $28,010 | $5,920 | $22,090 |
| 2015 | $2,263 | $28,010 | $5,920 | $22,090 |
| 2014 | $2,262 | $28,010 | $5,920 | $22,090 |
| 2013 | $1,121 | $28,000 | $5,915 | $22,085 |
Source: Public Records
Map
Nearby Homes
- 457 E Woodrow Ave Unit 459
- 319 E Barthman Ave
- 292 E Barthman Ave
- 1696 Parsons Ave
- 314 E Woodrow Ave
- 1692 Parsons Ave
- 464 E Hinman Ave
- 472 E Hinman Ave
- 1676 Parsons Ave
- 332 E Hinman Ave
- 524 E Hinman Ave
- 308 Hosack St
- 255 E Woodrow Ave
- 238 E Barthman Ave
- 466 E Morrill Ave
- 480-482 E Morrill Ave
- 1756 Bruck St
- 1657 Ann St
- 495 E Welch Ave
- 386 E Welch Ave
- 1818 Parsons Ave
- 1814 Parsons Ave
- 1800 Parsons Ave
- 442 E Innis Ave Unit 444
- 447 Olpp Ave
- 1809 Parsons Ave
- 448 E Innis Ave Unit 448
- 451 Olpp Ave
- 1793 Parsons Ave
- 1801 Parsons Ave
- 452 E Innis Ave
- 1846 Parsons Ave
- 457 Olpp Ave
- 1793-1795 Parsons Ave Unit 795
- 1793-1795 Parsons Ave
- 458 E Innis Ave
- 459 Olpp Ave
- 1791 Parsons Ave
- 460 E Innis Ave Unit 462
- 460-462 E Innis Ave