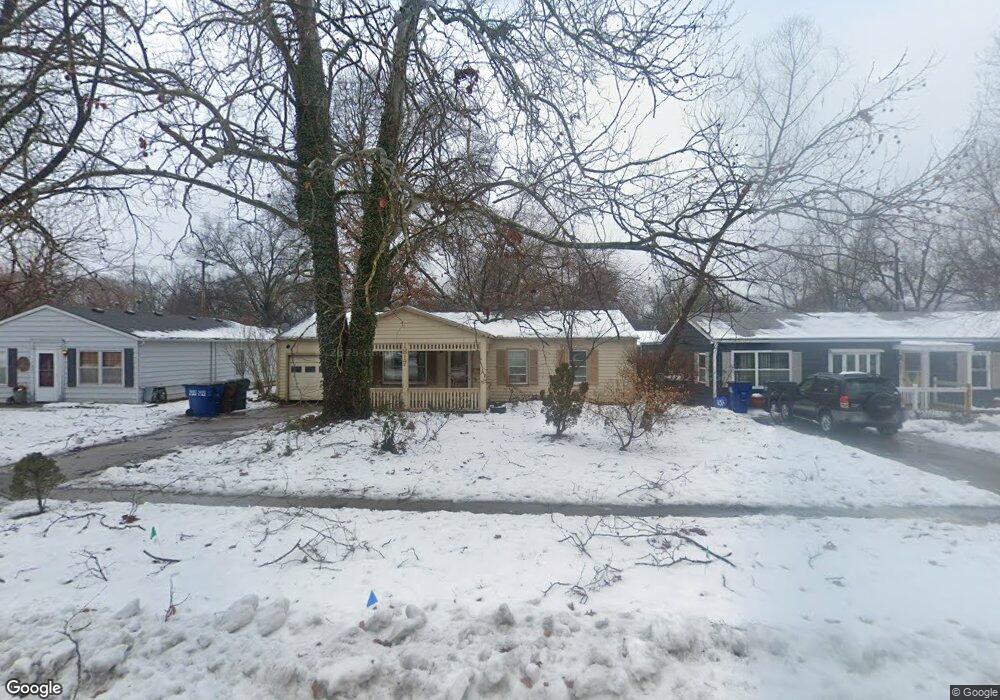
1817 Maple Ln Lawrence, KS 66044
Brook Creek NeighborhoodEstimated Value: $204,000 - $209,000
3
Beds
1
Bath
925
Sq Ft
$223/Sq Ft
Est. Value
About This Home
This home is located at 1817 Maple Ln, Lawrence, KS 66044 and is currently estimated at $206,709, approximately $223 per square foot. 1817 Maple Ln is a home located in Douglas County with nearby schools including New York Elementary School, Liberty Memorial Central Middle School, and Lawrence High School.
Ownership History
Date
Name
Owned For
Owner Type
Purchase Details
Closed on
Oct 18, 2007
Sold by
U S Bank Na
Bought by
Wilson Chad C
Current Estimated Value
Home Financials for this Owner
Home Financials are based on the most recent Mortgage that was taken out on this home.
Original Mortgage
$110,334
Outstanding Balance
$69,816
Interest Rate
6.47%
Mortgage Type
Purchase Money Mortgage
Estimated Equity
$136,893
Purchase Details
Closed on
May 11, 2007
Sold by
Kerns Randall L and Roe Jill
Bought by
U S Bank Na
Purchase Details
Closed on
Apr 30, 2007
Sold by
Kerns Randall
Bought by
Great Plains Home Solutions Llc
Purchase Details
Closed on
May 5, 2005
Sold by
Harper Robert L
Bought by
Kerns Randall and Kerns Randall L
Home Financials for this Owner
Home Financials are based on the most recent Mortgage that was taken out on this home.
Original Mortgage
$92,440
Interest Rate
7.65%
Mortgage Type
Fannie Mae Freddie Mac
Create a Home Valuation Report for This Property
The Home Valuation Report is an in-depth analysis detailing your home's value as well as a comparison with similar homes in the area
Home Values in the Area
Average Home Value in this Area
Purchase History
| Date | Buyer | Sale Price | Title Company |
|---|---|---|---|
| Wilson Chad C | -- | Kansas Secured Title | |
| U S Bank Na | $100,571 | None Available | |
| Great Plains Home Solutions Llc | -- | Heartland Title Co Inc | |
| Kerns Randall | -- | Commerce Title |
Source: Public Records
Mortgage History
| Date | Status | Borrower | Loan Amount |
|---|---|---|---|
| Open | Wilson Chad C | $110,334 | |
| Previous Owner | Kerns Randall | $92,440 |
Source: Public Records
Tax History
| Year | Tax Paid | Tax Assessment Tax Assessment Total Assessment is a certain percentage of the fair market value that is determined by local assessors to be the total taxable value of land and additions on the property. | Land | Improvement |
|---|---|---|---|---|
| 2025 | $2,827 | $23,391 | $5,750 | $17,641 |
| 2024 | $2,635 | $21,885 | $5,405 | $16,480 |
| 2023 | $2,676 | $21,149 | $5,175 | $15,974 |
| 2022 | $2,414 | $18,987 | $4,600 | $14,387 |
| 2021 | $2,155 | $16,296 | $4,368 | $11,928 |
| 2020 | $1,981 | $15,088 | $4,368 | $10,720 |
| 2019 | $1,851 | $14,135 | $3,798 | $10,337 |
| 2018 | $1,733 | $13,156 | $3,571 | $9,585 |
| 2017 | $1,635 | $12,294 | $3,571 | $8,723 |
| 2016 | $1,529 | $12,029 | $3,450 | $8,579 |
| 2015 | $1,557 | $12,236 | $3,450 | $8,786 |
| 2014 | $1,637 | $12,972 | $3,450 | $9,522 |
Source: Public Records
Map
Nearby Homes
- 2014 Maple Ln
- 1618 E Glenn Dr
- 1708 E 21st Terrace
- 1605 E 21st Place
- 5701 Johnson Ave
- 5804 Johnson Ave
- 2200 Harper St Unit C24
- 1950 Barker Ave
- 1630 Barker Ave
- 1226 Delaware St Unit 12
- 1327 New Jersey St
- 2146 Rhode Island St
- 1300 New York St Unit A & B
- 1300 New York St
- 1341 Rhode Island St
- 1128 Pennsylvania St
- 2115 Massachusetts St
- 1909 E 25th Terrace
- 2208 Massachusetts St
- 1111 New Jersey St
Your Personal Tour Guide
Ask me questions while you tour the home.