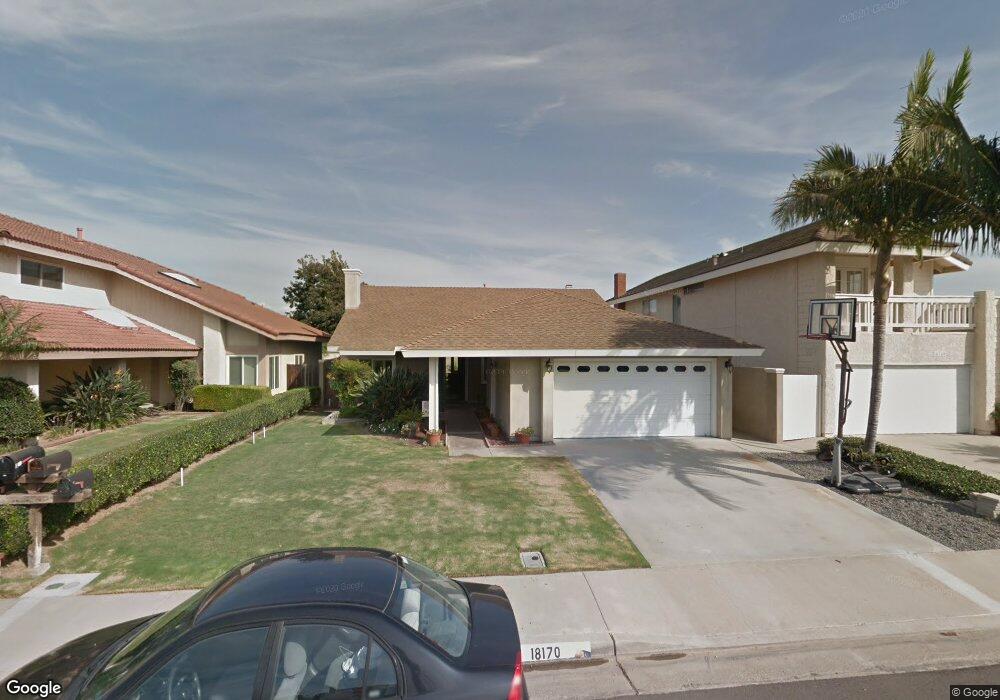
18170 Devonwood Cir Fountain Valley, CA 92708
Estimated Value: $1,258,000 - $1,420,000
3
Beds
2
Baths
1,669
Sq Ft
$805/Sq Ft
Est. Value
About This Home
This home is located at 18170 Devonwood Cir, Fountain Valley, CA 92708 and is currently estimated at $1,342,769, approximately $804 per square foot. 18170 Devonwood Cir is a home located in Orange County with nearby schools including Courreges (Roch) Elementary School, Fulton (Harry C.) Middle School, and Fountain Valley High School.
Ownership History
Date
Name
Owned For
Owner Type
Purchase Details
Closed on
Apr 6, 2020
Sold by
Richartz Scott and Richartz Mary
Bought by
Richartz Scott and Richartz Mary Jane
Current Estimated Value
Home Financials for this Owner
Home Financials are based on the most recent Mortgage that was taken out on this home.
Original Mortgage
$368,000
Outstanding Balance
$326,003
Interest Rate
3.4%
Mortgage Type
New Conventional
Estimated Equity
$1,016,766
Purchase Details
Closed on
Mar 25, 2002
Sold by
Lawson Gary W and Lawson Karen R
Bought by
Richartz Scott D and Richartz Mary Jane
Home Financials for this Owner
Home Financials are based on the most recent Mortgage that was taken out on this home.
Original Mortgage
$300,700
Interest Rate
7.18%
Create a Home Valuation Report for This Property
The Home Valuation Report is an in-depth analysis detailing your home's value as well as a comparison with similar homes in the area
Home Values in the Area
Average Home Value in this Area
Purchase History
| Date | Buyer | Sale Price | Title Company |
|---|---|---|---|
| Richartz Scott | -- | Accommodation | |
| Richartz Scott | -- | Fidelity National Title | |
| Richartz Scott D | $385,000 | Lawyers Title Company |
Source: Public Records
Mortgage History
| Date | Status | Borrower | Loan Amount |
|---|---|---|---|
| Open | Richartz Scott | $368,000 | |
| Previous Owner | Richartz Scott D | $300,700 | |
| Closed | Richartz Scott D | $45,800 |
Source: Public Records
Tax History Compared to Growth
Tax History
| Year | Tax Paid | Tax Assessment Tax Assessment Total Assessment is a certain percentage of the fair market value that is determined by local assessors to be the total taxable value of land and additions on the property. | Land | Improvement |
|---|---|---|---|---|
| 2025 | $6,401 | $568,752 | $414,513 | $154,239 |
| 2024 | $6,401 | $557,600 | $406,385 | $151,215 |
| 2023 | $6,251 | $546,667 | $398,417 | $148,250 |
| 2022 | $6,160 | $535,949 | $390,605 | $145,344 |
| 2021 | $6,042 | $525,441 | $382,946 | $142,495 |
| 2020 | $5,931 | $520,054 | $379,020 | $141,034 |
| 2019 | $5,809 | $509,857 | $371,588 | $138,269 |
| 2018 | $5,697 | $499,860 | $364,302 | $135,558 |
| 2017 | $5,606 | $490,059 | $357,159 | $132,900 |
| 2016 | $5,365 | $480,450 | $350,155 | $130,295 |
| 2015 | $5,282 | $473,234 | $344,896 | $128,338 |
| 2014 | $5,177 | $463,964 | $338,139 | $125,825 |
Source: Public Records
Map
Nearby Homes
- 18241 Devonwood Cir
- 18162 Santa Adela Cir
- 139 Laburnum Ln
- 106 Osprey Ln
- 18417 Mount Kristina St
- 201 Road Runner Ln
- 120 Laburnam Ln
- 112 Parrot Ln
- 134 Pecan Ln
- 126 Pecan Ln
- 108 Pigeon Ln
- 209 Road Runner Ln
- 127 Sumac Ln
- 110 Sumac Ln
- 120 Sumac Ln
- 109 Pigeon Ln Unit 109
- 109 Pigeon Ln
- 202 Pigeon Ln
- 122 Hornbeam Ln
- 17807 Joshua Cir
- 18160 Devonwood Cir
- 18180 Devonwood Cir
- 18150 Devonwood Cir
- 18190 Devonwood Cir
- 18151 S 3rd St
- 18141 S 3rd St
- 18161 S 3rd St
- 18200 Devonwood Cir
- 18131 S 3rd St
- 18171 S 3rd St
- 18171 Devonwood Cir
- 18140 Devonwood Cir
- 18181 Devonwood Cir
- 18161 Devonwood Cir
- 18191 Devonwood Cir
- 18121 S 3rd St
- 18173 S 3rd St
- 18151 Devonwood Cir
- 18210 Devonwood Cir
- 18201 Devonwood Cir