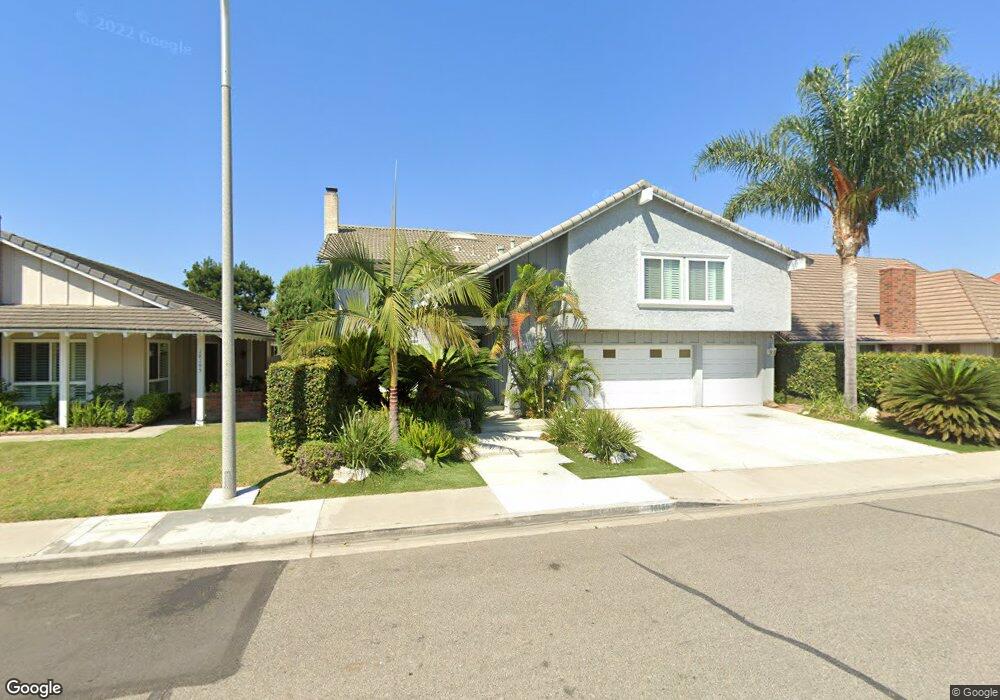
18185 Santa Sophia Cir Fountain Valley, CA 92708
Estimated Value: $1,621,000 - $1,934,000
4
Beds
3
Baths
2,710
Sq Ft
$657/Sq Ft
Est. Value
About This Home
This home is located at 18185 Santa Sophia Cir, Fountain Valley, CA 92708 and is currently estimated at $1,779,898, approximately $656 per square foot. 18185 Santa Sophia Cir is a home located in Orange County with nearby schools including Courreges (Roch) Elementary School, Fulton (Harry C.) Middle School, and Fountain Valley High School.
Ownership History
Date
Name
Owned For
Owner Type
Purchase Details
Closed on
Sep 6, 2013
Sold by
Auxier Gordon D and Auxier Danette L
Bought by
Nguyen Hung and Nguyen Minh Thu
Current Estimated Value
Home Financials for this Owner
Home Financials are based on the most recent Mortgage that was taken out on this home.
Original Mortgage
$408,500
Outstanding Balance
$104,292
Interest Rate
4.36%
Mortgage Type
New Conventional
Estimated Equity
$1,675,606
Purchase Details
Closed on
Aug 7, 2006
Sold by
Auxier Gordon D and Auxier Danette L
Bought by
Auxier Gordon D and Auxier Danette L
Home Financials for this Owner
Home Financials are based on the most recent Mortgage that was taken out on this home.
Original Mortgage
$150,000
Interest Rate
6.76%
Mortgage Type
New Conventional
Purchase Details
Closed on
Apr 29, 2003
Sold by
Kinnsch Donald L and Kinnsch Cecelia M
Bought by
Auxier Gordon D and Auxier Danette
Home Financials for this Owner
Home Financials are based on the most recent Mortgage that was taken out on this home.
Original Mortgage
$500,800
Interest Rate
5.37%
Mortgage Type
Purchase Money Mortgage
Create a Home Valuation Report for This Property
The Home Valuation Report is an in-depth analysis detailing your home's value as well as a comparison with similar homes in the area
Home Values in the Area
Average Home Value in this Area
Purchase History
| Date | Buyer | Sale Price | Title Company |
|---|---|---|---|
| Nguyen Hung | $817,000 | Wfg Title Company Of Ca | |
| Auxier Gordon D | -- | First American Title Co | |
| Auxier Gordon D | $626,000 | Chicago Title Insurance Co |
Source: Public Records
Mortgage History
| Date | Status | Borrower | Loan Amount |
|---|---|---|---|
| Open | Nguyen Hung | $408,500 | |
| Previous Owner | Auxier Gordon D | $150,000 | |
| Previous Owner | Auxier Gordon D | $500,800 |
Source: Public Records
Tax History Compared to Growth
Tax History
| Year | Tax Paid | Tax Assessment Tax Assessment Total Assessment is a certain percentage of the fair market value that is determined by local assessors to be the total taxable value of land and additions on the property. | Land | Improvement |
|---|---|---|---|---|
| 2025 | $10,899 | $1,001,526 | $813,135 | $188,391 |
| 2024 | $10,899 | $981,889 | $797,191 | $184,698 |
| 2023 | $10,644 | $962,637 | $781,560 | $181,077 |
| 2022 | $10,492 | $943,762 | $766,235 | $177,527 |
| 2021 | $10,288 | $925,257 | $751,210 | $174,047 |
| 2020 | $10,228 | $915,770 | $743,507 | $172,263 |
| 2019 | $10,014 | $897,814 | $728,928 | $168,886 |
| 2018 | $9,820 | $880,210 | $714,635 | $165,575 |
| 2017 | $9,664 | $862,951 | $700,622 | $162,329 |
| 2016 | $9,240 | $846,031 | $686,884 | $159,147 |
| 2015 | $9,099 | $833,323 | $676,566 | $156,757 |
| 2014 | $8,935 | $817,000 | $663,313 | $153,687 |
Source: Public Records
Map
Nearby Homes
- 18162 Santa Adela Cir
- 18241 Devonwood Cir
- 139 Laburnum Ln
- 18417 Mount Kristina St
- 18017 Hazel Ct
- 18566 Santa Andrea St
- 17807 Joshua Cir
- 106 Osprey Ln
- 120 Laburnam Ln
- 112 Parrot Ln
- 201 Road Runner Ln
- 108 Pigeon Ln
- 18621 Santa Ramona St
- 8405 Sweetwater Cir
- 126 Pecan Ln
- 134 Pecan Ln
- 209 Road Runner Ln
- 127 Sumac Ln
- 109 Pigeon Ln Unit 109
- 109 Pigeon Ln
- 18173 Santa Sophia Cir
- 18195 Santa Sophia Cir
- 18186 Santa Cecilia
- 18207 Santa Sophia Cir
- 18196 Santa Cecilia
- 18174 Santa Cecilia
- 18161 Santa Sophia Cir
- 18186 Santa Sophia Cir
- 18208 Santa Cecilia
- 18174 Santa Sophia Cir
- 18196 Santa Sophia Cir
- 18162 Santa Cecilia
- 18219 Santa Sophia Cir
- 18162 Santa Sophia Cir
- 18208 Santa Sophia Cir
- 18220 Santa Cecilia
- 18220 Santa Sophia Cir
- 18231 Santa Sophia Cir
- 18185 Santa Joanana
- 18185 Santa Cecilia