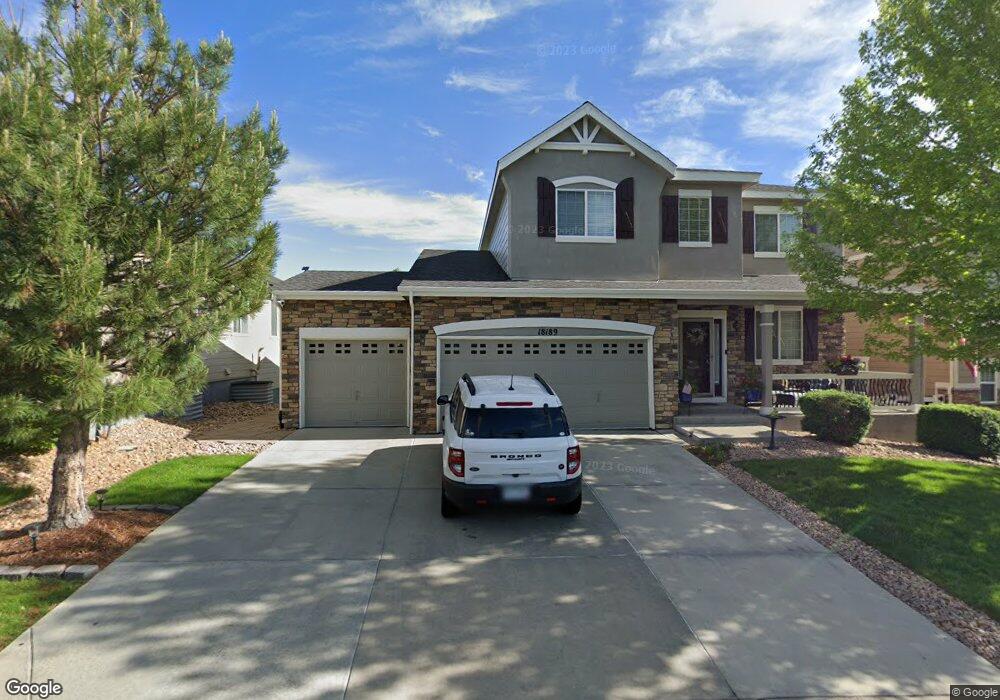
18189 Shadbury Ln Parker, CO 80134
Estimated Value: $742,000 - $797,000
5
Beds
4
Baths
3,683
Sq Ft
$208/Sq Ft
Est. Value
About This Home
This home is located at 18189 Shadbury Ln, Parker, CO 80134 and is currently estimated at $767,770, approximately $208 per square foot. 18189 Shadbury Ln is a home located in Douglas County with nearby schools including Gold Rush Elementary School, Cimarron Middle School, and Legend High School.
Ownership History
Date
Name
Owned For
Owner Type
Purchase Details
Closed on
Sep 19, 2014
Sold by
Devore Cory A and Devore Michelle D
Bought by
Jewell Sean M and Jewell Joelynne L
Current Estimated Value
Home Financials for this Owner
Home Financials are based on the most recent Mortgage that was taken out on this home.
Original Mortgage
$417,000
Outstanding Balance
$319,241
Interest Rate
4.14%
Mortgage Type
New Conventional
Estimated Equity
$448,529
Purchase Details
Closed on
Mar 30, 2011
Sold by
Richmond American Homes Of Colorado Inc
Bought by
Devore Cory A and Devore Michelle D
Home Financials for this Owner
Home Financials are based on the most recent Mortgage that was taken out on this home.
Original Mortgage
$324,000
Interest Rate
5.04%
Mortgage Type
New Conventional
Purchase Details
Closed on
Nov 19, 2009
Sold by
Twin Silos Llc
Bought by
Citywide Banks
Create a Home Valuation Report for This Property
The Home Valuation Report is an in-depth analysis detailing your home's value as well as a comparison with similar homes in the area
Home Values in the Area
Average Home Value in this Area
Purchase History
| Date | Buyer | Sale Price | Title Company |
|---|---|---|---|
| Jewell Sean M | $445,000 | Fidelity National Title Ins | |
| Devore Cory A | $360,000 | American Home Title & Escrow | |
| Citywide Banks | -- | -- |
Source: Public Records
Mortgage History
| Date | Status | Borrower | Loan Amount |
|---|---|---|---|
| Open | Jewell Sean M | $417,000 | |
| Previous Owner | Devore Cory A | $324,000 |
Source: Public Records
Tax History Compared to Growth
Tax History
| Year | Tax Paid | Tax Assessment Tax Assessment Total Assessment is a certain percentage of the fair market value that is determined by local assessors to be the total taxable value of land and additions on the property. | Land | Improvement |
|---|---|---|---|---|
| 2024 | $6,374 | $53,600 | $9,080 | $44,520 |
| 2023 | $6,426 | $53,600 | $9,080 | $44,520 |
| 2022 | $4,919 | $39,000 | $6,220 | $32,780 |
| 2021 | $5,059 | $39,000 | $6,220 | $32,780 |
| 2020 | $4,896 | $38,520 | $7,520 | $31,000 |
| 2019 | $4,917 | $38,520 | $7,520 | $31,000 |
| 2018 | $4,358 | $33,590 | $6,770 | $26,820 |
| 2017 | $4,136 | $33,590 | $6,770 | $26,820 |
| 2016 | $3,930 | $32,370 | $7,140 | $25,230 |
| 2015 | $3,980 | $32,370 | $7,140 | $25,230 |
| 2014 | $3,781 | $28,290 | $6,410 | $21,880 |
Source: Public Records
Map
Nearby Homes
- 18236 Shadbury Ln
- 12032 Triple Crown Dr
- 11857 Dodworth St
- 11993 Triple Crown Dr
- 12152 Coral Burst Ln
- 12247 Coral Burst Ln
- 12195 Hornbeam St
- 12267 Coral Burst Ln
- 12291 Coral Burst Ct
- 5322 Brian Dr
- 17867 Herrera Dr
- 18001 Herrera Dr
- 18235 Caffey Dr
- 18059 French Creek Ave
- 12659 Boggs St
- 18173 E Saskatoon Place
- 11690 Yellow Daisy Dr
- 17548 Bluetrail Ave
- 12541 Prince Creek Dr
- 17659 E Iron Ore Ave
- 18165 Shadbury Ln
- 18213 Shadbury Ln
- 18141 Shadbury Ln
- 18237 Shadbury Ln
- 18117 Shadbury Ln
- 18261 Shadbury Ln
- 18188 Shadbury Ln
- 18164 Shadbury Ln
- 18212 Shadbury Ln
- 18140 Shadbury Ln
- 18093 Shadbury Ln
- 18285 Shadbury Ln
- 18116 Shadbury Ln
- 18260 Shadbury Ln
- 18284 Shadbury Ln
- 18187 Tennyson Ln
- 18211 Tennyson Ln
- 18092 Shadbury Ln
- 18163 Tennyson Ln
- 18139 Tennyson Ln