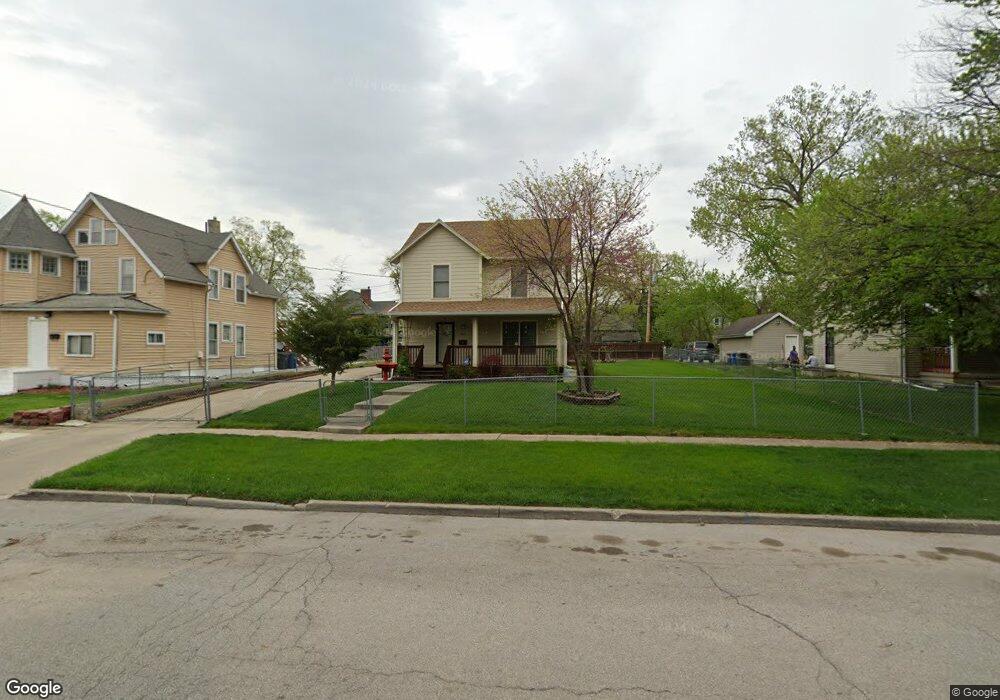
1819 9th St Des Moines, IA 50314
River Bend NeighborhoodEstimated Value: $165,000 - $215,000
4
Beds
2
Baths
1,287
Sq Ft
$151/Sq Ft
Est. Value
About This Home
This home is located at 1819 9th St, Des Moines, IA 50314 and is currently estimated at $194,627, approximately $151 per square foot. 1819 9th St is a home located in Polk County with nearby schools including Moulton Elementary School, Harding Middle School, and North High School.
Ownership History
Date
Name
Owned For
Owner Type
Purchase Details
Closed on
Nov 18, 2008
Sold by
River Bend Association Inc
Bought by
Lam Kevin T and Le Cindy
Current Estimated Value
Purchase Details
Closed on
May 16, 2003
Sold by
Community Housing Development Corp
Bought by
Lam Kevin T and Le Anh Kieu Thi
Home Financials for this Owner
Home Financials are based on the most recent Mortgage that was taken out on this home.
Original Mortgage
$101,510
Interest Rate
5.9%
Mortgage Type
Purchase Money Mortgage
Create a Home Valuation Report for This Property
The Home Valuation Report is an in-depth analysis detailing your home's value as well as a comparison with similar homes in the area
Home Values in the Area
Average Home Value in this Area
Purchase History
| Date | Buyer | Sale Price | Title Company |
|---|---|---|---|
| Lam Kevin T | -- | None Available | |
| Lam Kevin T | $101,500 | -- |
Source: Public Records
Mortgage History
| Date | Status | Borrower | Loan Amount |
|---|---|---|---|
| Previous Owner | Lam Kevin T | $101,510 |
Source: Public Records
Tax History Compared to Growth
Tax History
| Year | Tax Paid | Tax Assessment Tax Assessment Total Assessment is a certain percentage of the fair market value that is determined by local assessors to be the total taxable value of land and additions on the property. | Land | Improvement |
|---|---|---|---|---|
| 2025 | $3,114 | $186,800 | $10,300 | $176,500 |
| 2024 | $3,114 | $168,800 | $9,100 | $159,700 |
| 2023 | $2,746 | $168,800 | $9,100 | $159,700 |
| 2022 | $2,724 | $125,400 | $7,000 | $118,400 |
| 2021 | $2,560 | $125,400 | $7,000 | $118,400 |
| 2020 | $2,654 | $111,200 | $6,200 | $105,000 |
| 2019 | $2,684 | $111,200 | $6,200 | $105,000 |
| 2018 | $2,652 | $108,400 | $5,900 | $102,500 |
| 2017 | $2,458 | $108,400 | $5,900 | $102,500 |
| 2016 | $2,390 | $99,400 | $5,400 | $94,000 |
| 2015 | $2,390 | $99,400 | $5,400 | $94,000 |
| 2014 | $684 | $96,300 | $5,300 | $91,000 |
Source: Public Records
Map
Nearby Homes