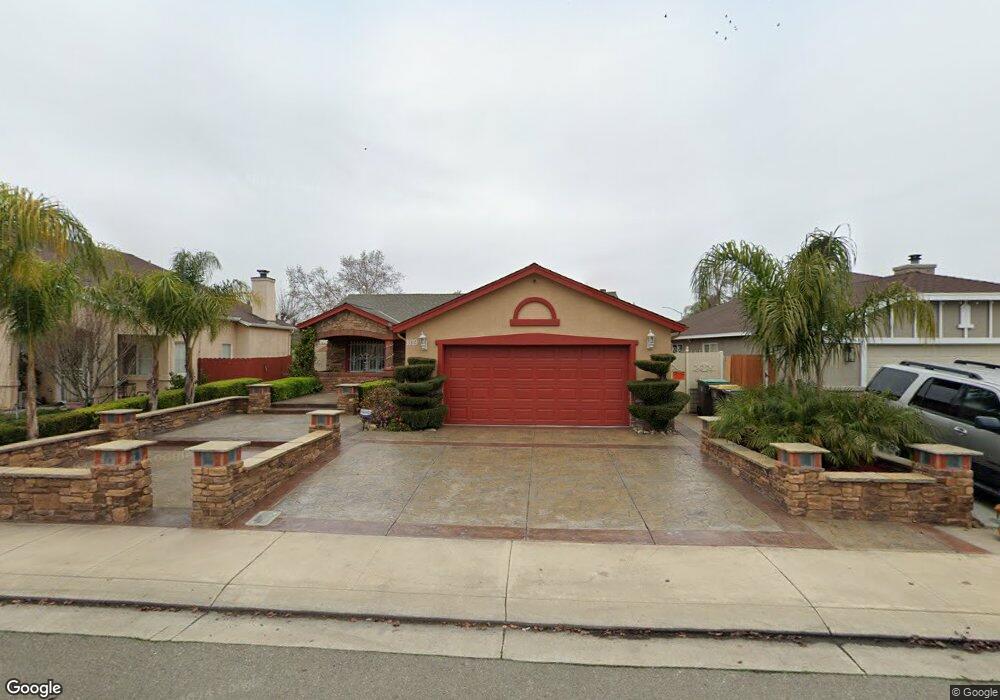
1819 Torrey Pines Ct Stockton, CA 95206
Seaport NeighborhoodEstimated Value: $282,000 - $399,000
3
Beds
2
Baths
1,085
Sq Ft
$331/Sq Ft
Est. Value
About This Home
This home is located at 1819 Torrey Pines Ct, Stockton, CA 95206 and is currently estimated at $358,960, approximately $330 per square foot. 1819 Torrey Pines Ct is a home located in San Joaquin County with nearby schools including Taylor Leadership Academy, San Joaquin Elementary School, and John Marshall Elementary School.
Ownership History
Date
Name
Owned For
Owner Type
Purchase Details
Closed on
Feb 10, 1997
Sold by
Florsheim Bros Ptp
Bought by
Preciado Martin and Preciado Antonia
Current Estimated Value
Home Financials for this Owner
Home Financials are based on the most recent Mortgage that was taken out on this home.
Original Mortgage
$87,730
Outstanding Balance
$10,178
Interest Rate
7.85%
Mortgage Type
FHA
Estimated Equity
$348,782
Create a Home Valuation Report for This Property
The Home Valuation Report is an in-depth analysis detailing your home's value as well as a comparison with similar homes in the area
Home Values in the Area
Average Home Value in this Area
Purchase History
| Date | Buyer | Sale Price | Title Company |
|---|---|---|---|
| Preciado Martin | $92,000 | Chicago Title Co |
Source: Public Records
Mortgage History
| Date | Status | Borrower | Loan Amount |
|---|---|---|---|
| Open | Preciado Martin | $87,730 |
Source: Public Records
Tax History Compared to Growth
Tax History
| Year | Tax Paid | Tax Assessment Tax Assessment Total Assessment is a certain percentage of the fair market value that is determined by local assessors to be the total taxable value of land and additions on the property. | Land | Improvement |
|---|---|---|---|---|
| 2025 | $2,014 | $157,478 | $40,711 | $116,767 |
| 2024 | $1,980 | $154,391 | $39,913 | $114,478 |
| 2023 | $1,934 | $151,365 | $39,131 | $112,234 |
| 2022 | $1,814 | $148,398 | $38,364 | $110,034 |
| 2021 | $1,748 | $145,489 | $37,612 | $107,877 |
| 2020 | $1,780 | $143,998 | $37,227 | $106,771 |
| 2019 | $1,771 | $141,176 | $36,498 | $104,678 |
| 2018 | $2,181 | $138,409 | $35,783 | $102,626 |
| 2017 | $1,995 | $135,696 | $35,082 | $100,614 |
| 2016 | $2,002 | $133,035 | $34,394 | $98,641 |
| 2014 | $1,905 | $128,471 | $33,214 | $95,257 |
Source: Public Records
Map
Nearby Homes
- 2650 S Fresno Ave
- 2128 Green River Ln
- 1232 Denver Ave
- 1409 Laguna Cir
- 1413 Laguna Cir
- 1823 Fort Hall Place
- 2050 Grey Stone Dr
- 1156 Derrick Dr
- 2242 Port Trinity Cir
- 2079 Gordon Verner Cir
- 2215 Dune Place
- 1890 Gordon Verner Cir
- 3330 Konig Ct
- 3745 Wild Rose Ln
- 1526 Kimiyo St
- 2402 Sailboat Ct
- 2428 Shell Ct
- 3412 Shogoro Ln
- 864 W 5th St
- 3779 Zeally Ln
- 1831 Torrey Pines Ct
- 1807 Torrey Pines Ct
- 1839 Torrey Pines Ct
- 1824 Hogan Ct
- 1816 Hogan Ct
- 1830 Hogan Ct
- 1855 Torrey Pines Ct
- 1830 Torrey Pines Ct
- 1818 Torrey Pines Ct
- 2731 S Fresno Ave
- 1844 Hogan Ct
- 1836 Torrey Pines Ct
- 1852 Torrey Pines Ct
- 1858 Hogan Ct
- 1869 Torrey Pines Ct
- 2682 S Fresno Ave
- 2714 S Fresno Ave
- 2749 S Fresno Ave
- 2666 S Fresno Ave
- 2722 S Fresno Ave