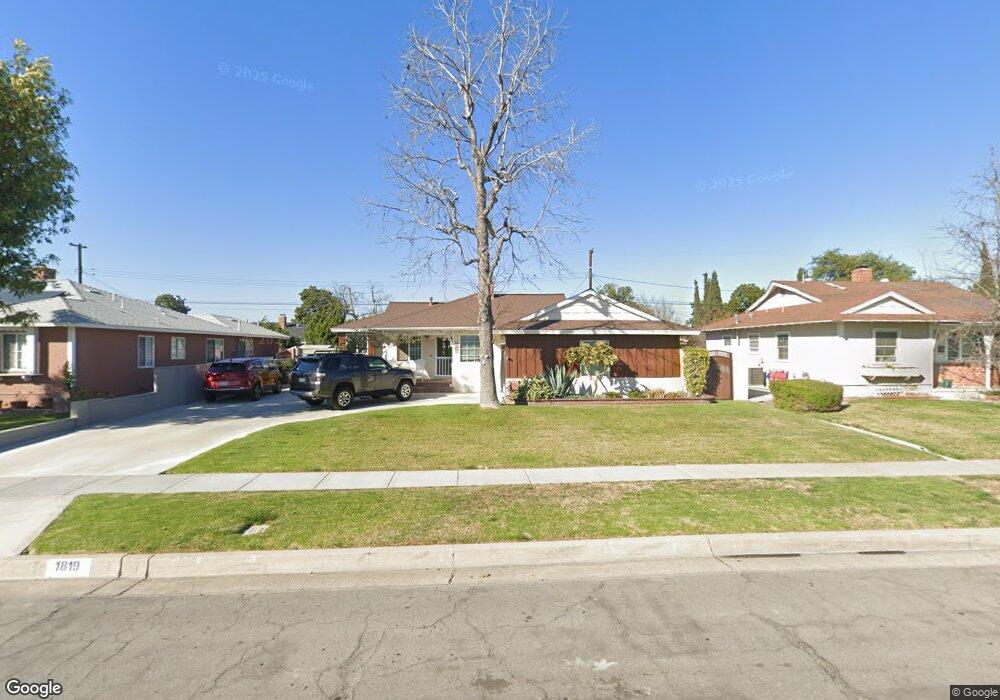
1819 W Cherry Ave Fullerton, CA 92833
Estimated Value: $852,457 - $932,000
3
Beds
2
Baths
1,206
Sq Ft
$737/Sq Ft
Est. Value
About This Home
This home is located at 1819 W Cherry Ave, Fullerton, CA 92833 and is currently estimated at $888,364, approximately $736 per square foot. 1819 W Cherry Ave is a home located in Orange County with nearby schools including Pacific Drive Elementary School, Nicolas Junior High School, and Buena Park High School.
Ownership History
Date
Name
Owned For
Owner Type
Purchase Details
Closed on
Dec 28, 2021
Sold by
Cagley and Janet
Bought by
Cagley David
Current Estimated Value
Home Financials for this Owner
Home Financials are based on the most recent Mortgage that was taken out on this home.
Original Mortgage
$340,000
Outstanding Balance
$267,550
Interest Rate
2.34%
Mortgage Type
New Conventional
Estimated Equity
$620,814
Purchase Details
Closed on
Jan 16, 2003
Sold by
Cagley David Lee
Bought by
Cagley David Lee and Cagley Janet
Home Financials for this Owner
Home Financials are based on the most recent Mortgage that was taken out on this home.
Original Mortgage
$243,750
Interest Rate
5.97%
Purchase Details
Closed on
Mar 2, 2000
Sold by
Petrocella William H and Petrocella Jeanette
Bought by
Cagley David Lee
Home Financials for this Owner
Home Financials are based on the most recent Mortgage that was taken out on this home.
Original Mortgage
$157,916
Interest Rate
8.25%
Mortgage Type
FHA
Create a Home Valuation Report for This Property
The Home Valuation Report is an in-depth analysis detailing your home's value as well as a comparison with similar homes in the area
Purchase History
| Date | Buyer | Sale Price | Title Company |
|---|---|---|---|
| Cagley David | -- | Provident Title | |
| Cagley David Lee | -- | Southland Title Corporation | |
| Cagley David Lee | $160,000 | Fidelity National Title Co |
Source: Public Records
Mortgage History
| Date | Status | Borrower | Loan Amount |
|---|---|---|---|
| Open | Cagley David | $340,000 | |
| Previous Owner | Cagley David Lee | $243,750 | |
| Previous Owner | Cagley David Lee | $157,916 |
Source: Public Records
Tax History
| Year | Tax Paid | Tax Assessment Tax Assessment Total Assessment is a certain percentage of the fair market value that is determined by local assessors to be the total taxable value of land and additions on the property. | Land | Improvement |
|---|---|---|---|---|
| 2025 | $3,476 | $302,019 | $209,077 | $92,942 |
| 2024 | $3,476 | $296,098 | $204,978 | $91,120 |
| 2023 | $3,389 | $290,293 | $200,959 | $89,334 |
| 2022 | $3,436 | $284,601 | $197,018 | $87,583 |
| 2021 | $3,378 | $279,021 | $193,155 | $85,866 |
| 2020 | $3,359 | $276,160 | $191,174 | $84,986 |
| 2019 | $3,276 | $270,746 | $187,426 | $83,320 |
| 2018 | $3,227 | $265,438 | $183,751 | $81,687 |
| 2017 | $3,174 | $260,234 | $180,148 | $80,086 |
| 2016 | $3,110 | $255,132 | $176,616 | $78,516 |
| 2015 | $3,026 | $251,300 | $173,963 | $77,337 |
| 2014 | $2,940 | $246,378 | $170,555 | $75,823 |
Source: Public Records
Map
Nearby Homes
- 1836 W Southgate Ave
- 801 S Courtney Ave
- 2009 W Oak Ave
- 1850 W Orangethorpe Ave
- 1850 W Orangethorpe Ave Unit 24
- 1850 W Orangethorpe Ave Unit 44
- 2100 W Valencia Dr
- 1510 W Orangethorpe Ave
- 2380 W Orangethorpe Ave Unit 14
- 1467 W Roberta Ave
- 1422 Peckham St Unit A
- 2210 W Coronet Ave
- 2057 W Coronet Ave
- 2321 Williamson Ave
- 2136 W Clover Ave
- 1919 W Coronet Ave Unit 75
- 1919 W Coronet Ave
- 1919 W Coronet Ave Unit 126
- 1919 W Coronet Ave Unit 190
- 1919 W Coronet Ave Unit 79
- 1815 W Cherry Ave
- 1825 W Cherry Ave
- 1820 W Olive Ave
- 1826 W Olive Ave
- 1816 W Olive Ave
- 1829 W Cherry Ave
- 1809 W Cherry Ave
- 1820 W Cherry Ave
- 1830 W Olive Ave
- 1810 W Olive Ave
- 1816 W Cherry Ave
- 1826 W Cherry Ave
- 1833 W Cherry Ave
- 1801 W Cherry Ave
- 1830 W Cherry Ave
- 1810 W Cherry Ave
- 1834 W Olive Ave
- 1800 W Olive Ave
- 1834 W Cherry Ave
- 1800 W Cherry Ave
Your Personal Tour Guide
Ask me questions while you tour the home.