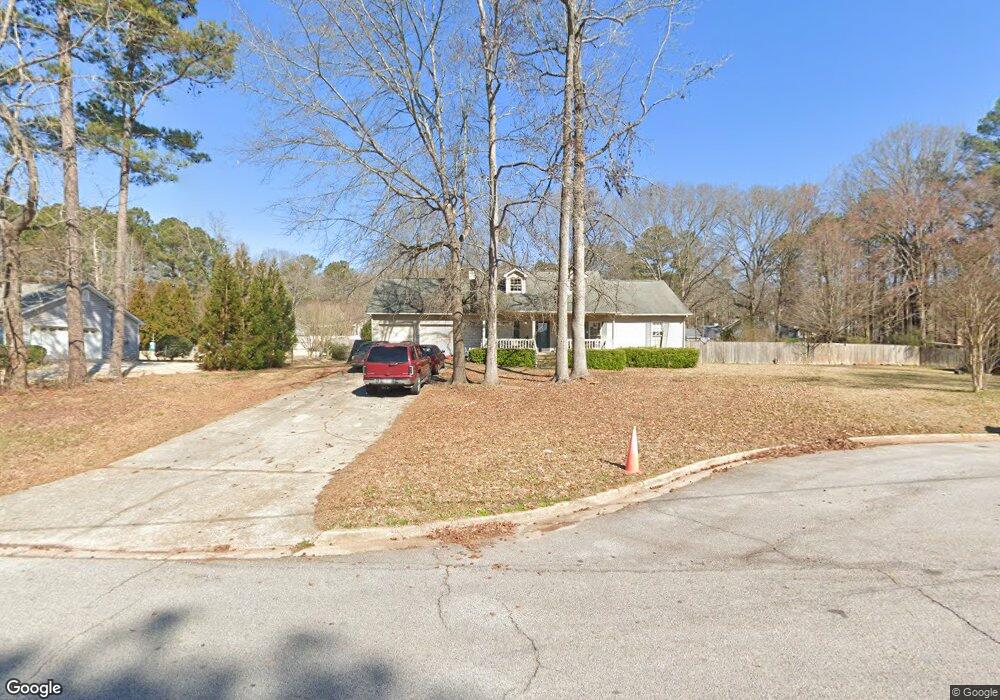
182 Brookwood Estates Trail Stockbridge, GA 30281
Estimated Value: $275,263 - $287,000
3
Beds
2
Baths
1,682
Sq Ft
$167/Sq Ft
Est. Value
About This Home
This home is located at 182 Brookwood Estates Trail, Stockbridge, GA 30281 and is currently estimated at $281,566, approximately $167 per square foot. 182 Brookwood Estates Trail is a home located in Henry County with nearby schools including Cotton Indian Elementary School, Stockbridge Middle School, and Stockbridge High School.
Ownership History
Date
Name
Owned For
Owner Type
Purchase Details
Closed on
Sep 2, 2009
Sold by
American General Finl Svcs
Bought by
Balazar Belinda D
Current Estimated Value
Home Financials for this Owner
Home Financials are based on the most recent Mortgage that was taken out on this home.
Original Mortgage
$115,371
Outstanding Balance
$74,953
Interest Rate
5.14%
Mortgage Type
FHA
Estimated Equity
$206,613
Purchase Details
Closed on
Oct 7, 2008
Sold by
Nash Kimberly
Bought by
American General Finl Svcs In
Purchase Details
Closed on
Jun 7, 2002
Sold by
Alley Raymond C and Alley Dina M
Bought by
Nash Kimberly
Home Financials for this Owner
Home Financials are based on the most recent Mortgage that was taken out on this home.
Original Mortgage
$116,875
Interest Rate
6.77%
Mortgage Type
New Conventional
Create a Home Valuation Report for This Property
The Home Valuation Report is an in-depth analysis detailing your home's value as well as a comparison with similar homes in the area
Home Values in the Area
Average Home Value in this Area
Purchase History
| Date | Buyer | Sale Price | Title Company |
|---|---|---|---|
| Balazar Belinda D | $117,500 | -- | |
| American General Finl Svcs In | $130,000 | -- | |
| Nash Kimberly | $137,500 | -- |
Source: Public Records
Mortgage History
| Date | Status | Borrower | Loan Amount |
|---|---|---|---|
| Open | Balazar Belinda D | $115,371 | |
| Previous Owner | Nash Kimberly | $116,875 |
Source: Public Records
Tax History Compared to Growth
Tax History
| Year | Tax Paid | Tax Assessment Tax Assessment Total Assessment is a certain percentage of the fair market value that is determined by local assessors to be the total taxable value of land and additions on the property. | Land | Improvement |
|---|---|---|---|---|
| 2025 | $3,047 | $111,904 | $14,000 | $97,904 |
| 2024 | $3,047 | $101,160 | $14,000 | $87,160 |
| 2023 | $2,584 | $108,000 | $10,000 | $98,000 |
| 2022 | $2,462 | $81,400 | $10,000 | $71,400 |
| 2021 | $2,142 | $67,720 | $10,000 | $57,720 |
| 2020 | $2,029 | $62,840 | $8,000 | $54,840 |
| 2019 | $1,952 | $59,480 | $8,000 | $51,480 |
| 2018 | $1,876 | $56,160 | $8,000 | $48,160 |
| 2016 | $1,690 | $50,080 | $8,000 | $42,080 |
| 2015 | $1,530 | $44,960 | $6,000 | $38,960 |
| 2014 | $1,434 | $42,200 | $4,800 | $37,400 |
Source: Public Records
Map
Nearby Homes
- 159 Brookwood Estates Trail
- 0 N Highway 42 Unit 10627424
- 0 Highway 155 N Unit 7649185
- 180 Cowan Dr
- 2581 Union Church Rd SW
- 278 Sound Cir
- 286 Sound Cir
- 364 Sound Cir
- 0 Old Conyers Rd Unit 10574658
- 120 Montgomery Dr
- 104 Montgomery Dr
- 0 W Hemphill Rd Unit 10295429
- 0 W Hemphill Rd Unit 10536232
- 242 Summerford Place
- 125 Johnsons Walk Unit 2
- 1527 Old Conyers Rd Unit 4
- 65 Wynfield Dr
- 551 Hood Rd
- 95 Fern Ct
- 830 Anna Kathryn Dr
- 180 Brookwood Estates Trail
- 184 Brookwood Estates Trail
- 133 Brookwood Estates Ct
- 133 Brookwood Estates Ct
- 130 Brookwood Estates Ct Unit 3
- 185 Brookwood Estates Trail Unit 3
- 181 Brookwood Estates Trail
- 176 Brookwood Estates Trail
- 125 Brookwood Estates Ct
- 179 Brookwood Estates Trail
- 126 Brookwood Estates Ct
- 174 Brookwood Estates Trail
- 177 Brookwood Estates Trail
- 120 Brookwood Estates Ct Unit 3
- 115 Brookwood Estates Ct
- 115 Brookwood Estates Ct Unit 3
- 114 Brookwood Estates Ct
- 114 Brookwood Estates Ct Unit 11
- 769 Flat Rock Rd