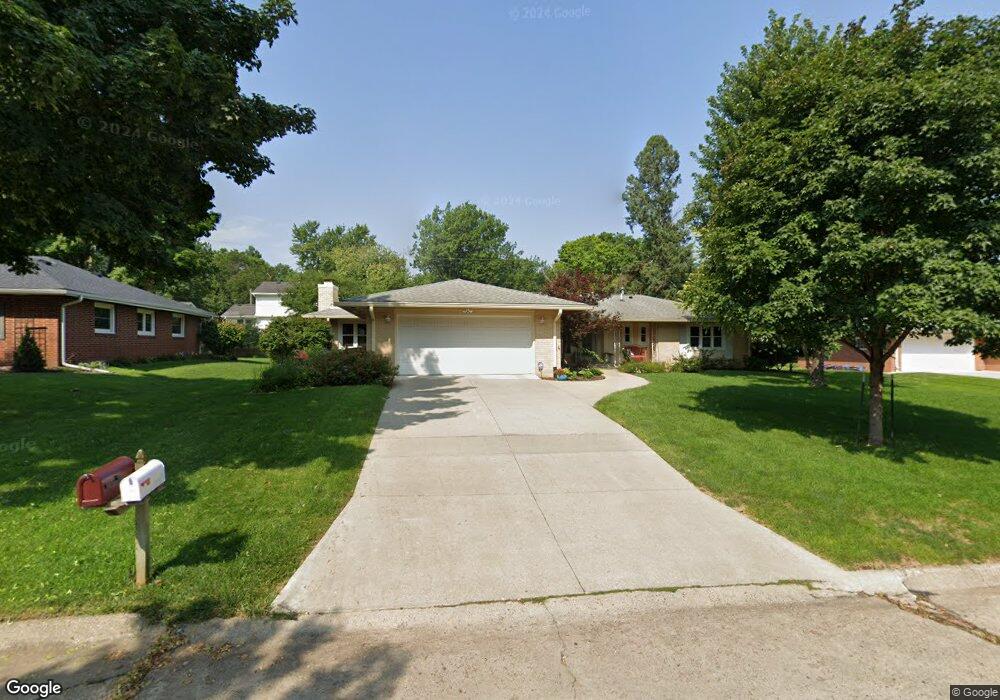
1820 78th St Windsor Heights, IA 50324
Estimated Value: $361,000 - $450,000
3
Beds
2
Baths
1,959
Sq Ft
$198/Sq Ft
Est. Value
About This Home
This home is located at 1820 78th St, Windsor Heights, IA 50324 and is currently estimated at $388,156, approximately $198 per square foot. 1820 78th St is a home located in Polk County with nearby schools including Indian Hills Junior High School, Valley Southwoods Freshman High School, and Valley High School.
Ownership History
Date
Name
Owned For
Owner Type
Purchase Details
Closed on
May 28, 2008
Sold by
Jacobsma Clair M and Jacobsma Glenda K
Bought by
Sweeney John E and Sweeney Katharine
Current Estimated Value
Home Financials for this Owner
Home Financials are based on the most recent Mortgage that was taken out on this home.
Original Mortgage
$214,400
Outstanding Balance
$136,911
Interest Rate
6.04%
Mortgage Type
Purchase Money Mortgage
Estimated Equity
$251,246
Purchase Details
Closed on
Oct 19, 2006
Sold by
Jacobsma Clair M and Jacobsma Glenda K
Bought by
Jacobsma Clair M and Jacobsma Glenda K
Purchase Details
Closed on
Oct 18, 2002
Sold by
Ryden Richard B and Ryden Kathryn P
Bought by
Jacobsma Clair M and Jacobsma Glenda K
Home Financials for this Owner
Home Financials are based on the most recent Mortgage that was taken out on this home.
Original Mortgage
$144,000
Interest Rate
5.67%
Create a Home Valuation Report for This Property
The Home Valuation Report is an in-depth analysis detailing your home's value as well as a comparison with similar homes in the area
Home Values in the Area
Average Home Value in this Area
Purchase History
| Date | Buyer | Sale Price | Title Company |
|---|---|---|---|
| Sweeney John E | $267,500 | None Available | |
| Jacobsma Clair M | -- | None Available | |
| Jacobsma Clair M | $179,500 | -- |
Source: Public Records
Mortgage History
| Date | Status | Borrower | Loan Amount |
|---|---|---|---|
| Open | Sweeney John E | $214,400 | |
| Previous Owner | Jacobsma Clair M | $144,000 |
Source: Public Records
Tax History Compared to Growth
Tax History
| Year | Tax Paid | Tax Assessment Tax Assessment Total Assessment is a certain percentage of the fair market value that is determined by local assessors to be the total taxable value of land and additions on the property. | Land | Improvement |
|---|---|---|---|---|
| 2025 | $5,684 | $373,900 | $59,300 | $314,600 |
| 2024 | $5,684 | $333,100 | $52,000 | $281,100 |
| 2023 | $6,184 | $333,100 | $52,000 | $281,100 |
| 2022 | $6,104 | $301,500 | $49,200 | $252,300 |
| 2021 | $5,746 | $301,500 | $49,200 | $252,300 |
| 2020 | $5,648 | $266,000 | $43,200 | $222,800 |
| 2019 | $5,736 | $266,000 | $43,200 | $222,800 |
| 2018 | $5,626 | $248,000 | $39,400 | $208,600 |
| 2017 | $5,172 | $248,000 | $39,400 | $208,600 |
| 2016 | $4,890 | $221,500 | $34,600 | $186,900 |
| 2015 | $4,890 | $221,500 | $34,600 | $186,900 |
| 2014 | $4,788 | $222,600 | $34,100 | $188,500 |
Source: Public Records
Map
Nearby Homes
- 8011 Northwest Dr
- 2077 NW 80th Ct
- 1808 80th St
- 1710 Plaza Cir
- 1916 74th St
- 8008 Cobblestone Rd
- 8075 Garrison Rd
- 8020 Cobblestone Rd
- 8024 Cobblestone Rd
- 2405 81st Cir
- 8195 Sunrise Blvd
- 8037 Cobblestone Ct
- 7215 Washington Ave
- 8112 Cobblestone Rd
- 8073 Cobblestone Rd
- 1516 73rd St
- 7136 Garrison Rd
- 2548 Pine Cir
- TBD Hickman Rd
- 7100 Holcomb Ave