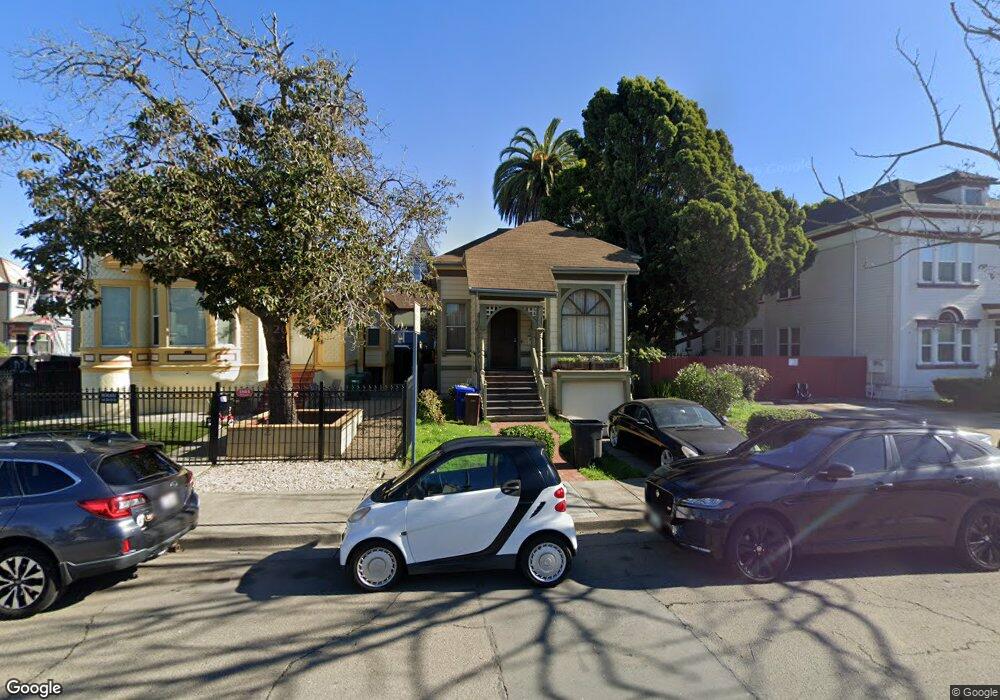
1820 West St Oakland, CA 94612
West Oakland NeighborhoodEstimated Value: $590,478 - $712,000
3
Beds
1
Bath
1,179
Sq Ft
$539/Sq Ft
Est. Value
About This Home
This home is located at 1820 West St, Oakland, CA 94612 and is currently estimated at $635,620, approximately $539 per square foot. 1820 West St is a home located in Alameda County with nearby schools including M. L. King Jr. Elementary School, West Oakland Middle School, and McClymonds High School.
Ownership History
Date
Name
Owned For
Owner Type
Purchase Details
Closed on
Jul 10, 2007
Sold by
Smith Christopher and Ryan Smith Patricia
Bought by
Johnson Fredrick
Current Estimated Value
Home Financials for this Owner
Home Financials are based on the most recent Mortgage that was taken out on this home.
Original Mortgage
$368,000
Outstanding Balance
$228,929
Interest Rate
6.41%
Mortgage Type
Purchase Money Mortgage
Estimated Equity
$406,691
Purchase Details
Closed on
Mar 7, 2002
Sold by
Yee Chiu Moo Sun and Yee Chiu Kit
Bought by
Smith Christopher and Ryan Smith Patricia
Home Financials for this Owner
Home Financials are based on the most recent Mortgage that was taken out on this home.
Original Mortgage
$182,800
Interest Rate
6.99%
Create a Home Valuation Report for This Property
The Home Valuation Report is an in-depth analysis detailing your home's value as well as a comparison with similar homes in the area
Home Values in the Area
Average Home Value in this Area
Purchase History
| Date | Buyer | Sale Price | Title Company |
|---|---|---|---|
| Johnson Fredrick | $460,000 | Fidelity National Title | |
| Smith Christopher | $240,000 | Placer Title Company |
Source: Public Records
Mortgage History
| Date | Status | Borrower | Loan Amount |
|---|---|---|---|
| Open | Johnson Fredrick | $368,000 | |
| Previous Owner | Smith Christopher | $182,800 | |
| Closed | Smith Christopher | $50,000 |
Source: Public Records
Tax History
| Year | Tax Paid | Tax Assessment Tax Assessment Total Assessment is a certain percentage of the fair market value that is determined by local assessors to be the total taxable value of land and additions on the property. | Land | Improvement |
|---|---|---|---|---|
| 2025 | $9,349 | $597,177 | $181,253 | $422,924 |
| 2024 | $9,349 | $585,331 | $177,699 | $414,632 |
| 2023 | $9,793 | $580,721 | $174,216 | $406,505 |
| 2022 | $9,411 | $562,337 | $170,801 | $398,536 |
| 2021 | $8,990 | $551,177 | $167,453 | $390,724 |
| 2020 | $20,928 | $552,454 | $165,736 | $386,718 |
| 2019 | $8,551 | $541,626 | $162,488 | $379,138 |
| 2018 | $8,373 | $531,010 | $159,303 | $371,707 |
| 2017 | $8,051 | $520,600 | $156,180 | $364,420 |
| 2016 | $6,829 | $440,000 | $132,000 | $308,000 |
Source: Public Records
Map
Nearby Homes
- 1923 West St
- 814 20th St
- 836 20th St
- 829 21st St Unit 3
- 779 17th St
- 769 17th St
- 856 21st St
- 881 21st St
- 811 W Grand Ave
- 857 W Grand Ave
- 850 W Grand Ave Unit 17
- 2327 San Pablo Ave
- 845 Isabella St
- 2103 Myrtle St
- 874 Isabella St
- 866 Isabella St
- 630 Thomas L Berkley Way Unit 403
- 622 22nd St
- 595 22nd St Unit 595
- 1920 Linden St
Your Personal Tour Guide
Ask me questions while you tour the home.