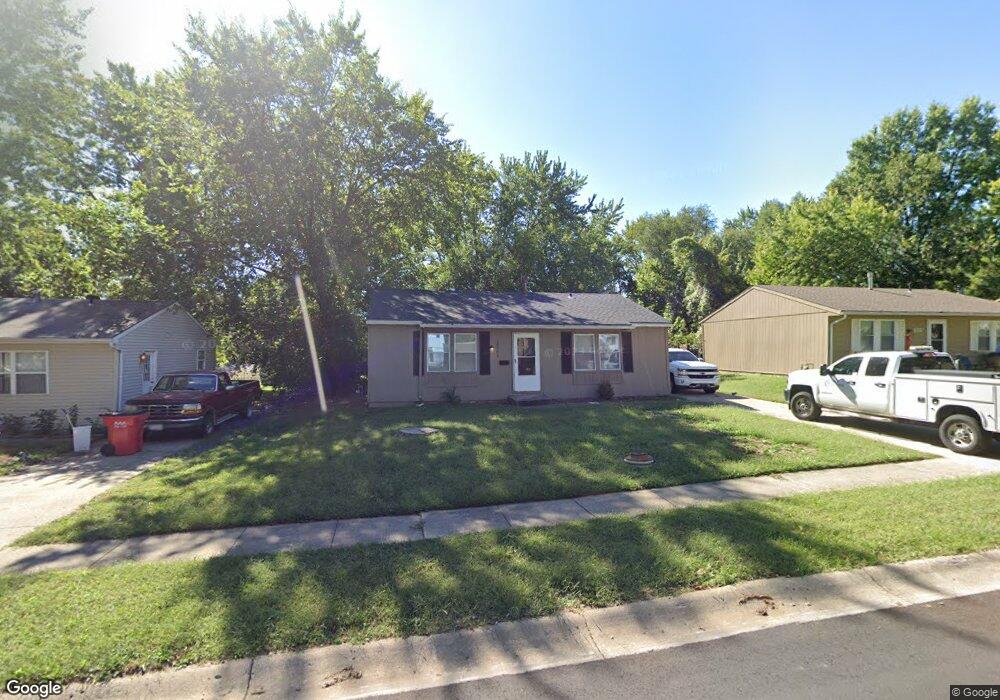
18201 E 19th St N Independence, MO 64058
Estimated Value: $119,000 - $182,000
3
Beds
1
Bath
1,008
Sq Ft
$149/Sq Ft
Est. Value
About This Home
This home is located at 18201 E 19th St N, Independence, MO 64058 and is currently estimated at $150,519, approximately $149 per square foot. 18201 E 19th St N is a home located in Jackson County with nearby schools including Fort Osage High School.
Ownership History
Date
Name
Owned For
Owner Type
Purchase Details
Closed on
Dec 31, 2020
Sold by
Vb One Llc
Bought by
Vb Tow Llc
Current Estimated Value
Purchase Details
Closed on
Aug 27, 2020
Sold by
Capital Real Estate Investments Llc
Bought by
Vg One Llc
Purchase Details
Closed on
Aug 7, 2018
Sold by
Truman Heritage Habitat For Humanity
Bought by
Capital Real Estate Investments Llc
Purchase Details
Closed on
Jan 20, 2017
Sold by
Jpmorgan Chase Bank National Association
Bought by
Truman Heritage Habitat For Humanity
Purchase Details
Closed on
Aug 21, 2013
Sold by
Olson Bryan R and Olson Wendy A
Bought by
Jpmorgan Chase Bank Na
Purchase Details
Closed on
Oct 22, 1998
Sold by
Neece Franklin E and Neece Mary V
Bought by
Olson Bryan and Olson Wendy A
Home Financials for this Owner
Home Financials are based on the most recent Mortgage that was taken out on this home.
Original Mortgage
$44,928
Interest Rate
6.61%
Mortgage Type
FHA
Create a Home Valuation Report for This Property
The Home Valuation Report is an in-depth analysis detailing your home's value as well as a comparison with similar homes in the area
Purchase History
| Date | Buyer | Sale Price | Title Company |
|---|---|---|---|
| Vb Tow Llc | -- | None Available | |
| Vg One Llc | -- | Total Title Services | |
| Capital Real Estate Investments Llc | -- | Clear Title | |
| Truman Heritage Habitat For Humanity | -- | Continental Title | |
| Jpmorgan Chase Bank Na | $41,026 | None Available | |
| Olson Bryan | -- | Stewart Title |
Source: Public Records
Mortgage History
| Date | Status | Borrower | Loan Amount |
|---|---|---|---|
| Previous Owner | Olson Bryan | $44,928 |
Source: Public Records
Tax History
| Year | Tax Paid | Tax Assessment Tax Assessment Total Assessment is a certain percentage of the fair market value that is determined by local assessors to be the total taxable value of land and additions on the property. | Land | Improvement |
|---|---|---|---|---|
| 2025 | $1,421 | $16,081 | $3,300 | $12,781 |
| 2024 | $1,408 | $15,884 | $2,423 | $13,461 |
| 2023 | $1,408 | $15,884 | $1,562 | $14,322 |
| 2022 | $1,138 | $12,160 | $3,848 | $8,312 |
| 2021 | $1,139 | $12,160 | $3,848 | $8,312 |
| 2020 | $1,094 | $11,513 | $3,848 | $7,665 |
| 2019 | $1,072 | $11,513 | $3,848 | $7,665 |
| 2018 | $370 | $3,956 | $2,296 | $1,660 |
| 2017 | $370 | $3,956 | $2,296 | $1,660 |
| 2016 | $333 | $3,856 | $2,296 | $1,560 |
Source: Public Records
Map
Nearby Homes
- 1824 Vista Dr
- 1715 N Viking Dr
- 18310 E 18th St N
- 17800 E Whitney Rd
- 1609 N Ponca Dr
- 18407 E Lexington Rd
- 18901 E Lynchburg Place N
- 1600 N Dover St
- 19115 E Roxsbury Ln
- 2011 N Hines Rd
- 19113 E 14th St N
- 17805 E Union School Rd
- 18001 E 12th St N
- 1116 N Swope Dr
- 1113 N Swope Dr
- 18404 E Blackhawk Trail
- 1207 N Atherton Rd
- 17301 E Kentucky Rd
- 19704 E 14th Terrace N
- 19706 E 14th St N
- 18203 E 19th St N
- 18109 E 19th St N
- 18107 E 19th St N
- 18202 E 19th St N
- 18200 E 19th St N
- 18205 E 19th St N
- 18204 E 19th St N
- 18106 E 19th St N
- 18105 E 19th St N
- 18206 E 18th Terrace N
- 18207 E 19th St N
- 18206 E 19th St N
- 18200 E 18th Terrace N
- 18104 E 19th St N
- 18104 E 19th Street North N A
- 18204 E 18th Terrace N
- 18202 E 18th Terrace N
- 18208 E 18th Terrace N
- 18106 E 18th Terrace N
- 18208 E 19th St N
Your Personal Tour Guide
Ask me questions while you tour the home.