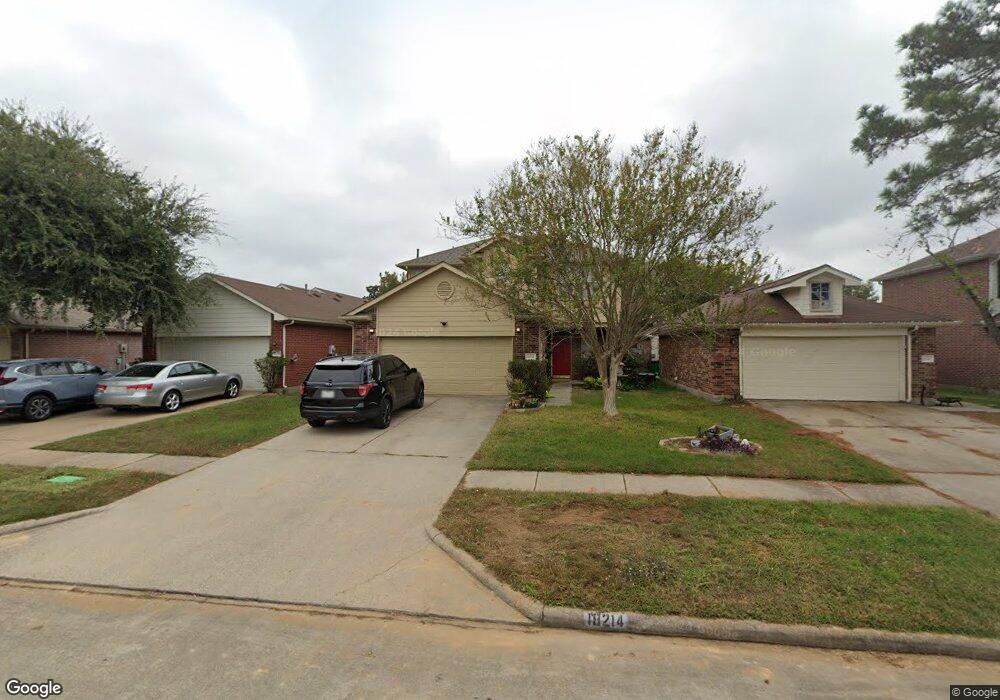
18214 Campbellford Dr Tomball, TX 77377
Northpointe NeighborhoodEstimated Value: $243,336 - $264,000
3
Beds
3
Baths
1,585
Sq Ft
$159/Sq Ft
Est. Value
About This Home
This home is located at 18214 Campbellford Dr, Tomball, TX 77377 and is currently estimated at $251,584, approximately $158 per square foot. 18214 Campbellford Dr is a home located in Harris County with nearby schools including Willow Creek Elementary School, Willow Wood Junior High School, and Northpointe Intermediate School.
Ownership History
Date
Name
Owned For
Owner Type
Purchase Details
Closed on
Feb 8, 2007
Sold by
Federal Home Loan Mortgage Corporation
Bought by
Bonilla Jose R and Bonilla Fidelia
Current Estimated Value
Purchase Details
Closed on
Aug 1, 2006
Sold by
Alonzo Marie A
Bought by
Federal Home Loan Mortgage Corporation
Purchase Details
Closed on
Oct 5, 1999
Sold by
Tlv Management Inc
Bought by
Alonzo Marie A
Home Financials for this Owner
Home Financials are based on the most recent Mortgage that was taken out on this home.
Original Mortgage
$83,957
Interest Rate
7.83%
Mortgage Type
FHA
Purchase Details
Closed on
Jun 1, 1999
Sold by
Blomfield David L and Blomfield Michelle L
Bought by
Tlv Management Inc
Purchase Details
Closed on
May 2, 1997
Sold by
Jmc Homes Inc
Bought by
Blomfield David L and Blomfield Michelle L
Home Financials for this Owner
Home Financials are based on the most recent Mortgage that was taken out on this home.
Original Mortgage
$56,000
Interest Rate
10.85%
Create a Home Valuation Report for This Property
The Home Valuation Report is an in-depth analysis detailing your home's value as well as a comparison with similar homes in the area
Home Values in the Area
Average Home Value in this Area
Purchase History
| Date | Buyer | Sale Price | Title Company |
|---|---|---|---|
| Bonilla Jose R | -- | None Available | |
| Federal Home Loan Mortgage Corporation | $95,564 | None Available | |
| Alonzo Marie A | -- | Fidelity National Title | |
| Tlv Management Inc | $61,000 | -- | |
| Blomfield David L | -- | American Title |
Source: Public Records
Mortgage History
| Date | Status | Borrower | Loan Amount |
|---|---|---|---|
| Previous Owner | Alonzo Marie A | $83,957 | |
| Previous Owner | Blomfield David L | $56,000 |
Source: Public Records
Tax History Compared to Growth
Tax History
| Year | Tax Paid | Tax Assessment Tax Assessment Total Assessment is a certain percentage of the fair market value that is determined by local assessors to be the total taxable value of land and additions on the property. | Land | Improvement |
|---|---|---|---|---|
| 2025 | $5,737 | $234,683 | $40,122 | $194,561 |
| 2024 | $5,737 | $245,987 | $40,122 | $205,865 |
| 2023 | $5,737 | $245,260 | $40,122 | $205,138 |
| 2022 | $5,411 | $216,909 | $33,729 | $183,180 |
| 2021 | $4,437 | $172,226 | $30,863 | $141,363 |
| 2020 | $4,317 | $160,274 | $24,250 | $136,024 |
| 2019 | $4,226 | $153,764 | $20,943 | $132,821 |
| 2018 | $1,944 | $145,093 | $15,872 | $129,221 |
| 2017 | $3,466 | $123,650 | $15,872 | $107,778 |
| 2016 | $3,467 | $123,705 | $15,872 | $107,833 |
| 2015 | $3,020 | $114,000 | $15,872 | $98,128 |
| 2014 | $3,020 | $102,500 | $15,872 | $86,628 |
Source: Public Records
Map
Nearby Homes
- 12007 Northpointe Meadows Dr
- 12046 Westlock Dr
- 12242 Westlock Dr
- 12226 Westwold Dr
- 11902 Oakner Dr
- 12107 Westwold Dr
- 11934 Westwold Dr
- 11922 Westwold Dr
- 11831 Westlock Dr
- 12331 Westwold Dr
- 18135 Gravenhurst Ln
- 12022 Canyon Star Ln
- 12006 Canyon Star Ln
- 18314 Westlock St
- 17814 Winkler Willow Ct
- 12222 Brighton Brook Ln
- 19010 Canyon Star Ct
- 18703 Summercliff Ln
- 12414 Montebello Manor Ln
- 18814 Emery Meadows Ln
- 18210 Campbellford Dr
- 18218 Campbellford Dr
- 18206 Campbellford Dr
- 18222 Campbellford Dr
- 18227 Beaverdell Dr
- 18223 Beaverdell Dr
- 18202 Campbellford Dr
- 18231 Beaverdell Dr
- 18226 Campbellford Dr
- 18219 Beaverdell Dr
- 18235 Beaverdell Dr
- 18215 Beaverdell Dr
- 18138 Campbellford Dr
- 18230 Campbellford Dr
- 18215 Campbellford Dr
- 18219 Campbellford Dr
- 18211 Campbellford Dr
- 18239 Beaverdell Dr
- 18211 Beaverdell Dr
- 18223 Campbellford Dr