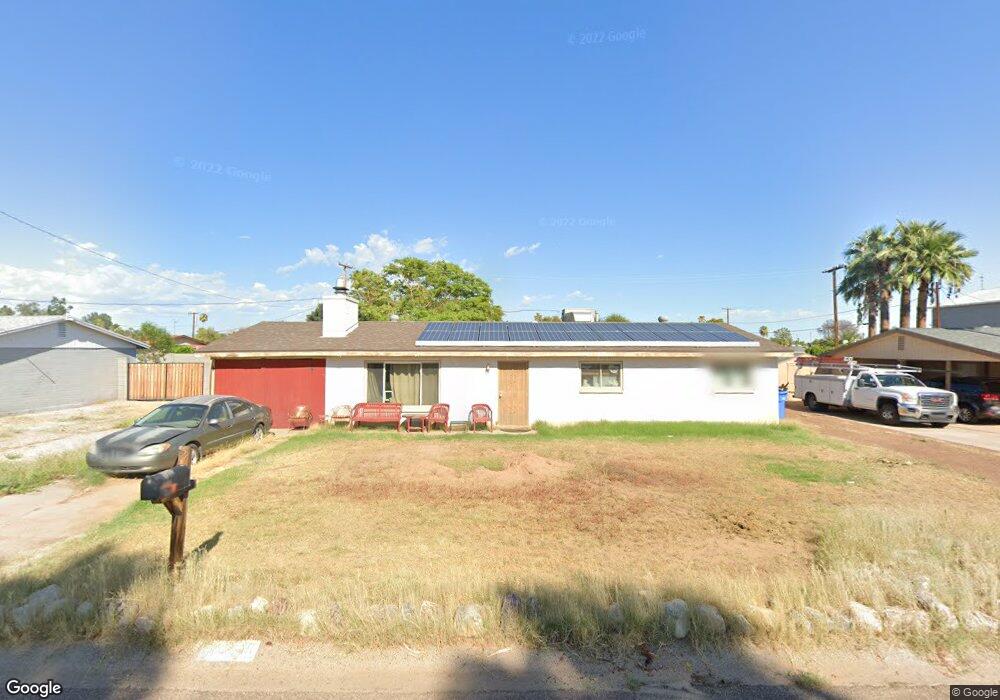
18219 N 41st St Phoenix, AZ 85032
Paradise Valley Village NeighborhoodEstimated Value: $338,000 - $438,000
Studio
2
Baths
1,440
Sq Ft
$271/Sq Ft
Est. Value
About This Home
This home is located at 18219 N 41st St, Phoenix, AZ 85032 and is currently estimated at $389,780, approximately $270 per square foot. 18219 N 41st St is a home located in Maricopa County with nearby schools including Whispering Wind Academy, Sunrise Middle School, and Paradise Valley High School.
Ownership History
Date
Name
Owned For
Owner Type
Purchase Details
Closed on
Aug 26, 2016
Sold by
Golladay Harriet
Bought by
Golladay Zachary and Golladay Sheri
Current Estimated Value
Home Financials for this Owner
Home Financials are based on the most recent Mortgage that was taken out on this home.
Original Mortgage
$95,000
Outstanding Balance
$75,858
Interest Rate
3.42%
Mortgage Type
VA
Estimated Equity
$313,922
Purchase Details
Closed on
Oct 27, 1998
Sold by
Schaible Leo F
Bought by
Golladay Harriet
Purchase Details
Closed on
Nov 15, 1996
Sold by
Rosen Ronald L and Mitchell Tina M
Bought by
Schaible Leo F
Home Financials for this Owner
Home Financials are based on the most recent Mortgage that was taken out on this home.
Original Mortgage
$81,646
Interest Rate
8.06%
Mortgage Type
FHA
Create a Home Valuation Report for This Property
The Home Valuation Report is an in-depth analysis detailing your home's value as well as a comparison with similar homes in the area
Home Values in the Area
Average Home Value in this Area
Purchase History
We collect this data history from publicly available records. To have your information removed, we recommend requesting removal directly through your county’s website.
| Date | Buyer | Sale Price | Title Company |
|---|---|---|---|
| Golladay Zachary | $100,000 | Grand Canyon Title Agency | |
| Golladay Harriet | $80,280 | -- | |
| Schaible Leo F | $82,000 | North American Title Agency |
Source: Public Records
Mortgage History
We collect this data history from publicly available records. To have your information removed, we recommend requesting removal directly through your county’s website.
| Date | Status | Borrower | Loan Amount |
|---|---|---|---|
| Open | Golladay Zachary | $95,000 | |
| Previous Owner | Schaible Leo F | $81,646 |
Source: Public Records
Tax History
| Year | Tax Paid | Tax Assessment Tax Assessment Total Assessment is a certain percentage of the fair market value that is determined by local assessors to be the total taxable value of land and additions on the property. | Land | Improvement |
|---|---|---|---|---|
| 2025 | $1,144 | $13,217 | -- | -- |
| 2024 | $1,090 | $12,588 | -- | -- |
| 2023 | $1,090 | $27,680 | $5,530 | $22,150 |
| 2022 | $1,080 | $20,810 | $4,160 | $16,650 |
| 2021 | $1,097 | $19,200 | $3,840 | $15,360 |
| 2020 | $1,060 | $17,520 | $3,500 | $14,020 |
| 2019 | $1,065 | $14,500 | $2,900 | $11,600 |
| 2018 | $1,026 | $12,550 | $2,510 | $10,040 |
| 2017 | $980 | $11,410 | $2,280 | $9,130 |
| 2016 | $964 | $11,360 | $2,270 | $9,090 |
| 2015 | $986 | $9,220 | $1,840 | $7,380 |
Source: Public Records
Map
Nearby Homes
- 18021 N 40th Place
- 4138 E Villa Maria Dr
- 18239 N 40th St Unit 159
- 18221 N 42nd St
- 17859 N 40th St
- 4240 E Desert Cactus St
- 18212 N 43rd Place
- 4301 E Bluefield Ave
- 4114 E Union Hills Dr Unit 1216
- 4114 E Union Hills Dr Unit 1185
- 4114 E Union Hills Dr Unit 1004
- 4114 E Union Hills Dr Unit 1233
- 18036 N Villa Rita Dr
- 18632 N 42nd Way
- 4345 E Annette Dr
- 18001 N 43rd Way Unit 2
- 4343 E Union Hills Dr
- 4371 E Villa Maria Dr
- 4014 E Morrow Dr
- 18805 N 39th Way Unit II
- 18201 N 41st St
- 4110 E Robert e Lee St
- 18211 N 41st St
- 18202 N 41st St
- 4101 E Robert e Lee St
- 18212 N 41st St Unit 101
- 18212 N 41st St Unit 102
- 18212 N 41st St Unit 104
- 18212 N 41st St Unit 103
- 4118 E Robert e Lee St
- 4119 E Villa Maria Dr
- 18218 N 41st St
- 18042 N 41st St Unit 1
- 18042 N 41st St Unit B
- 18042 N 41st St Unit $$$
- 18220 N 41st St
- 18042 N 41st Place
- 18225 N 41st St
- 18033 N 41st St
- 4126 E Desert Cactus St
Your Personal Tour Guide
Ask me questions while you tour the home.