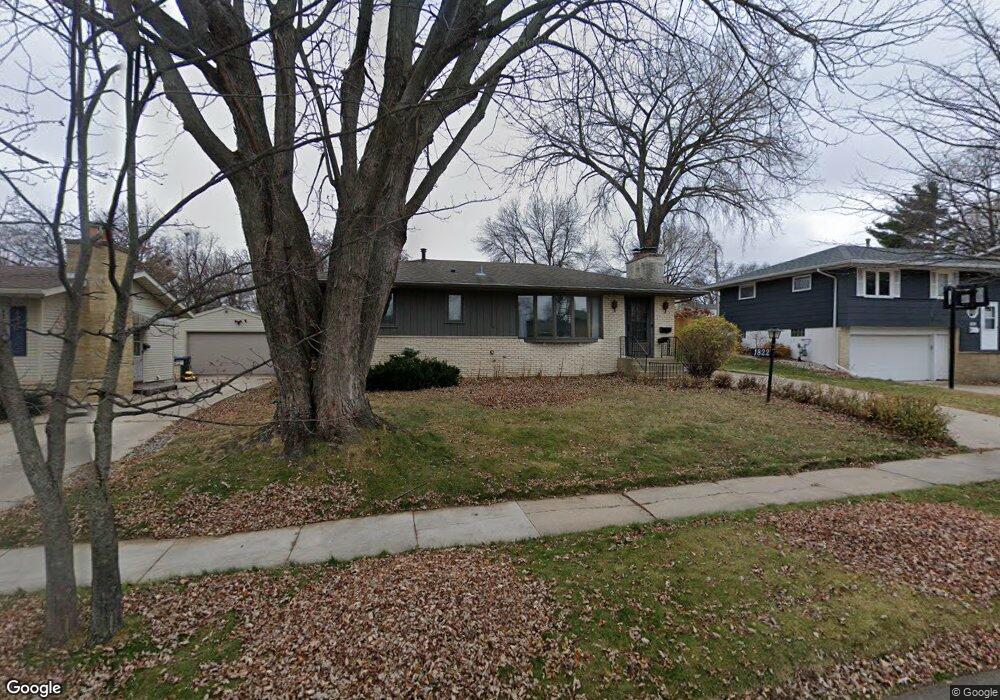
1822 35th St NW Rochester, MN 55901
John Adams NeighborhoodEstimated Value: $254,000 - $276,000
2
Beds
2
Baths
1,984
Sq Ft
$135/Sq Ft
Est. Value
About This Home
This home is located at 1822 35th St NW, Rochester, MN 55901 and is currently estimated at $267,546, approximately $134 per square foot. 1822 35th St NW is a home located in Olmsted County with nearby schools including Elton Hills Elementary School, John Adams Middle School, and John Marshall Senior High School.
Ownership History
Date
Name
Owned For
Owner Type
Purchase Details
Closed on
Apr 6, 2021
Sold by
Tbt Holdings Llc
Bought by
Schiltz Christian J and Schiltz Jenny E
Current Estimated Value
Home Financials for this Owner
Home Financials are based on the most recent Mortgage that was taken out on this home.
Original Mortgage
$209,000
Outstanding Balance
$188,397
Interest Rate
2.9%
Mortgage Type
New Conventional
Estimated Equity
$79,149
Purchase Details
Closed on
Apr 11, 2019
Sold by
Turnquist Benjamin
Bought by
Tbt Holdings Llc
Home Financials for this Owner
Home Financials are based on the most recent Mortgage that was taken out on this home.
Original Mortgage
$130,000
Interest Rate
4.4%
Mortgage Type
Commercial
Purchase Details
Closed on
Dec 10, 2018
Sold by
Action Conservators Inc
Bought by
Turanist Benjamin
Purchase Details
Closed on
Nov 9, 2010
Sold by
Schulz Jamie Robert
Bought by
Allendale Park Townhomes Llc
Create a Home Valuation Report for This Property
The Home Valuation Report is an in-depth analysis detailing your home's value as well as a comparison with similar homes in the area
Home Values in the Area
Average Home Value in this Area
Purchase History
| Date | Buyer | Sale Price | Title Company |
|---|---|---|---|
| Schiltz Christian J | $220,000 | Results Title | |
| Tbt Holdings Llc | $500 | Results Title | |
| Turanist Benjamin | $122,500 | Rochester Title & Escrow Co | |
| Allendale Park Townhomes Llc | -- | None Available | |
| Schiltz Christian Christian | $220,000 | -- |
Source: Public Records
Mortgage History
| Date | Status | Borrower | Loan Amount |
|---|---|---|---|
| Open | Schiltz Christian J | $209,000 | |
| Previous Owner | Tbt Holdings Llc | $130,000 | |
| Closed | Schiltz Christian Christian | $209,000 |
Source: Public Records
Tax History Compared to Growth
Tax History
| Year | Tax Paid | Tax Assessment Tax Assessment Total Assessment is a certain percentage of the fair market value that is determined by local assessors to be the total taxable value of land and additions on the property. | Land | Improvement |
|---|---|---|---|---|
| 2024 | $2,916 | $229,700 | $40,000 | $189,700 |
| 2023 | $2,588 | $220,400 | $40,000 | $180,400 |
| 2022 | $2,254 | $219,200 | $40,000 | $179,200 |
| 2021 | $2,220 | $181,800 | $35,000 | $146,800 |
| 2020 | $2,172 | $161,200 | $25,000 | $136,200 |
| 2019 | $1,726 | $151,200 | $25,000 | $126,200 |
| 2018 | $1,510 | $141,500 | $25,000 | $116,500 |
| 2017 | $1,482 | $128,600 | $25,000 | $103,600 |
| 2016 | $1,388 | $97,300 | $19,700 | $77,600 |
| 2015 | $645 | $89,200 | $19,200 | $70,000 |
| 2014 | -- | $89,200 | $19,200 | $70,000 |
| 2012 | -- | $90,900 | $19,324 | $71,576 |
Source: Public Records
Map
Nearby Homes
- 3305 18th Ave NW
- 1840 36th St NW
- 3522 18th Ave NW
- XXX County Road 22
- 2842 19th Ave NW
- 3925 18th Ave NW
- 3916 17th Ave NW
- 4017 18th Ave NW
- 4037 18th Ave NW
- 3012 Crescent Ln NW
- 1407 41st St NW
- 4017 11th Ave NW
- 4100 19 1 2 Ln NW
- xxx 41st St NW
- 2043 42nd St NW
- 2509 11th Ave NW
- 2326 16th Ave NW
- 905 Chalet Dr NW
- 3002 7th Ave NW
- 19 Elton Ridge Ct NW
- 1816 35th St NW
- 1828 35th St NW
- 1821 34th St NW
- 1810 35th St NW
- 1834 35th St NW
- 1815 34th St NW
- 1827 34th St NW
- 1809 34th St NW
- 1833 34th St NW
- 1840 35th St NW
- 3411 18th Ave NW Unit 3411
- 1821 35th St NW
- 1815 35th St NW
- 1827 35th St NW
- 1809 35th St NW
- 3405 18th Ave NW
- 1833 35th St NW
- 1839 34th St NW
- 1846 35th St NW
- 1803 35th St NW