Estimated Value: $188,000 - $249,000
2
Beds
1
Bath
918
Sq Ft
$228/Sq Ft
Est. Value
About This Home
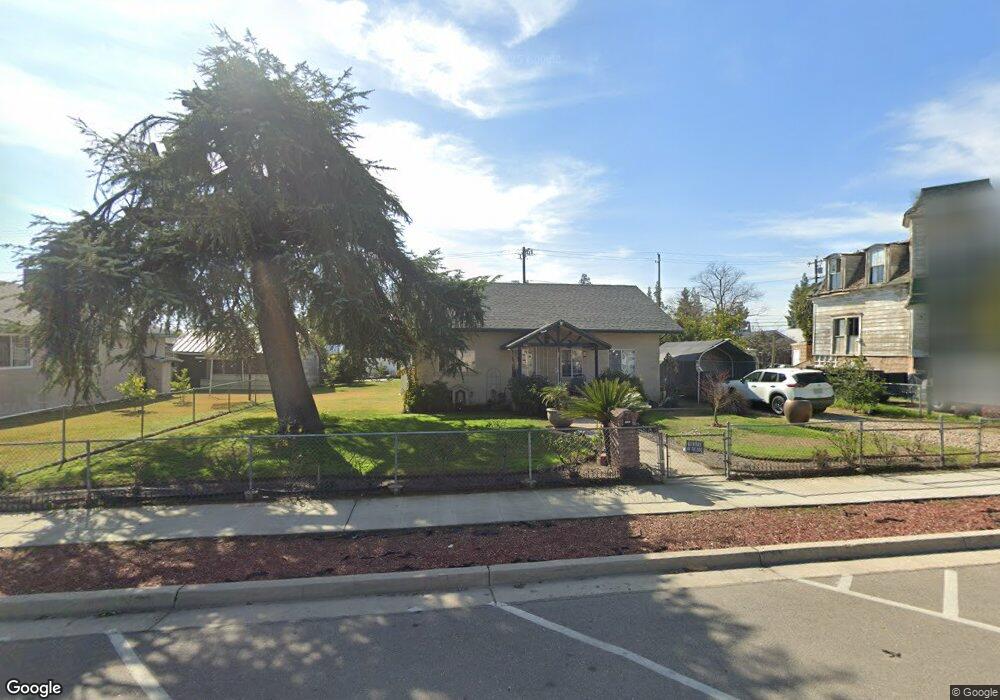
This home is located at 1823 Sylvia St, Selma, CA 93662 and is currently estimated at $209,448, approximately $228 per square foot. 1823 Sylvia St is a home located in Fresno County with nearby schools including James Garfield Elementary School, Abraham Lincoln Middle School, and Selma High School.
Ownership History
Date
Name
Owned For
Owner Type
Purchase Details
Closed on
Dec 27, 2021
Sold by
Gonzalez and Guillermina
Bought by
Gonzalez Efren
Current Estimated Value
Purchase Details
Closed on
Apr 3, 2003
Sold by
Gonzalez Efren
Bought by
Gonzalez Efren and Gonzalez Guillermina
Purchase Details
Closed on
Mar 1, 1995
Sold by
Navarro Alberto B and Navarro Aurelia V
Bought by
Gonzalez Efren
Home Financials for this Owner
Home Financials are based on the most recent Mortgage that was taken out on this home.
Original Mortgage
$40,000
Interest Rate
9.09%
Mortgage Type
Seller Take Back
Create a Home Valuation Report for This Property
The Home Valuation Report is an in-depth analysis detailing your home's value as well as a comparison with similar homes in the area
Home Values in the Area
Average Home Value in this Area
Purchase History
| Date | Buyer | Sale Price | Title Company |
|---|---|---|---|
| Gonzalez Efren | -- | None Listed On Document | |
| Gonzalez Efren | -- | -- | |
| Gonzalez Efren | $55,000 | Chicago Title Company |
Source: Public Records
Mortgage History
| Date | Status | Borrower | Loan Amount |
|---|---|---|---|
| Previous Owner | Gonzalez Efren | $40,000 |
Source: Public Records
Tax History Compared to Growth
Tax History
| Year | Tax Paid | Tax Assessment Tax Assessment Total Assessment is a certain percentage of the fair market value that is determined by local assessors to be the total taxable value of land and additions on the property. | Land | Improvement |
|---|---|---|---|---|
| 2025 | $1,980 | $94,474 | $33,576 | $60,898 |
| 2023 | $1,980 | $90,807 | $32,273 | $58,534 |
| 2022 | $1,888 | $89,028 | $31,641 | $57,387 |
| 2021 | $1,836 | $87,283 | $31,021 | $56,262 |
| 2020 | $1,806 | $86,389 | $30,703 | $55,686 |
| 2019 | $1,748 | $84,696 | $30,101 | $54,595 |
| 2018 | $1,703 | $83,036 | $29,511 | $53,525 |
| 2017 | $1,627 | $81,409 | $28,933 | $52,476 |
| 2016 | $1,479 | $79,814 | $28,366 | $51,448 |
| 2015 | $1,493 | $78,616 | $27,940 | $50,676 |
| 2014 | $1,443 | $77,077 | $27,393 | $49,684 |
Source: Public Records
Map
Nearby Homes