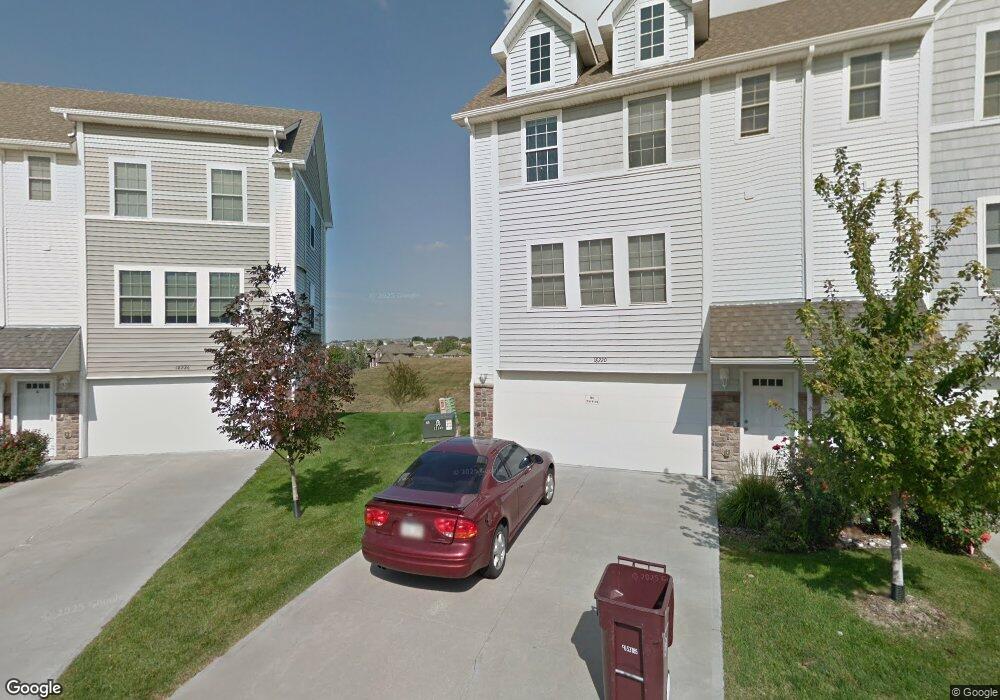
18230 Hayes Plaza Unit 25 Omaha, NE 68135
Southwest Omaha NeighborhoodEstimated Value: $206,695 - $208,000
2
Beds
2
Baths
1,056
Sq Ft
$196/Sq Ft
Est. Value
About This Home
This home is located at 18230 Hayes Plaza Unit 25, Omaha, NE 68135 and is currently estimated at $207,424, approximately $196 per square foot. 18230 Hayes Plaza Unit 25 is a home located in Douglas County with nearby schools including Wheeler Elementary School, Beadle Middle School, and Millard West High School.
Ownership History
Date
Name
Owned For
Owner Type
Purchase Details
Closed on
Oct 22, 2021
Sold by
Wallis Jackie A and Wallis Thomas S
Bought by
Dier Sally
Current Estimated Value
Home Financials for this Owner
Home Financials are based on the most recent Mortgage that was taken out on this home.
Original Mortgage
$142,500
Outstanding Balance
$129,947
Interest Rate
2.8%
Mortgage Type
New Conventional
Estimated Equity
$77,477
Purchase Details
Closed on
Aug 20, 2015
Sold by
Jensen Lisa A
Bought by
Wallis Jackie A and Wallis Thomas S
Purchase Details
Closed on
Apr 8, 2009
Sold by
Breining Kisha J and Breining Collette Kisha
Bought by
Jensen Lisa A
Home Financials for this Owner
Home Financials are based on the most recent Mortgage that was taken out on this home.
Original Mortgage
$122,637
Interest Rate
5.03%
Mortgage Type
FHA
Purchase Details
Closed on
Apr 3, 2007
Sold by
Triton Homes
Bought by
Breining Kitia J
Create a Home Valuation Report for This Property
The Home Valuation Report is an in-depth analysis detailing your home's value as well as a comparison with similar homes in the area
Home Values in the Area
Average Home Value in this Area
Purchase History
| Date | Buyer | Sale Price | Title Company |
|---|---|---|---|
| Dier Sally | $150,000 | Trustworthy T&E Llc | |
| Wallis Jackie A | $105,000 | None Available | |
| Jensen Lisa A | $125,000 | Nlta | |
| Breining Kitia J | $124,400 | -- |
Source: Public Records
Mortgage History
| Date | Status | Borrower | Loan Amount |
|---|---|---|---|
| Open | Dier Sally | $142,500 | |
| Previous Owner | Jensen Lisa A | $122,637 |
Source: Public Records
Tax History Compared to Growth
Tax History
| Year | Tax Paid | Tax Assessment Tax Assessment Total Assessment is a certain percentage of the fair market value that is determined by local assessors to be the total taxable value of land and additions on the property. | Land | Improvement |
|---|---|---|---|---|
| 2024 | $3,122 | $181,000 | $6,000 | $175,000 |
| 2023 | $3,122 | $156,800 | $6,000 | $150,800 |
| 2022 | $2,631 | $124,500 | $6,000 | $118,500 |
| 2021 | $2,618 | $124,500 | $6,000 | $118,500 |
| 2020 | $2,292 | $108,100 | $6,000 | $102,100 |
| 2019 | $2,299 | $108,100 | $6,000 | $102,100 |
| 2018 | $2,279 | $105,700 | $20,000 | $85,700 |
| 2017 | $1,963 | $105,700 | $20,000 | $85,700 |
| 2016 | $1,963 | $92,400 | $10,000 | $82,400 |
| 2015 | $2,296 | $92,400 | $10,000 | $82,400 |
| 2014 | $2,296 | $89,800 | $10,000 | $79,800 |
Source: Public Records
Map
Nearby Homes
- 6812 S 181st Ct
- 18337 Polk St
- 7008 S 183rd Ave
- 7119 S 180th Ave
- 7035 S 184th St
- 6326 S 178th St
- 7301 S 184th St
- 18628 Emiline St
- 18704 Washington St
- 6322 S 177th St
- 10821 S 178th Ave
- 18514 Olive Cir
- 17753 Edna St
- 17637 Monroe St
- 17737 Edna St
- 17849 Olive St
- 7112 S 177th St
- 6202 S 189th St
- 7354 S 185th St
- 7401 S 186th St
- 18208 Hayes Plaza Unit 20
- 18226 Hayes Plaza Unit 24
- 18238 Hayes Plaza Unit 27
- 18234 Hayes Plaza Unit 26
- 18226 Hayes Plaza
- 18208 Hayes Plaza
- 18212 Hayes Plaza Unit 21
- 18212 Hayes Plaza
- 18216 Hayes Plaza Unit 22
- 18220 Hayes Plaza Unit 23
- 18230 Hayes Plaza
- 18220 Hayes Plaza
- 18216 Hayes Plaza
- 18188 Hayes Ct
- 18188 Hayes Ct Unit 30
- 18215 Hayes Plaza
- 18211 Hayes Plaza Unit 33
- 18192 Hayes Ct
- 18207 Hayes Plaza
- 18184 Hayes Ct