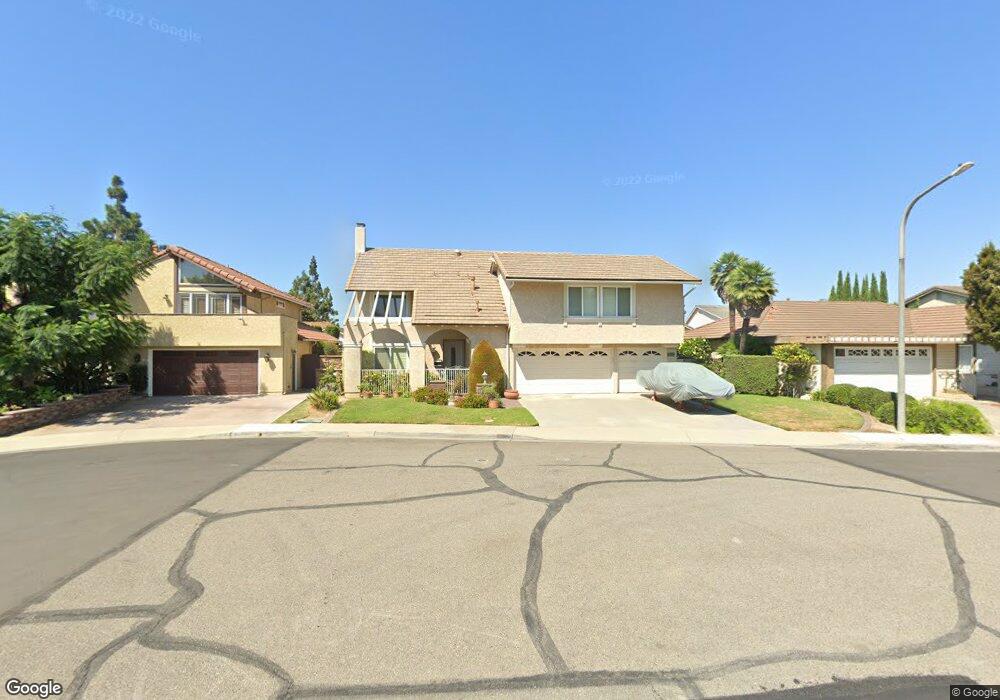
18231 Santa Sophia Cir Fountain Valley, CA 92708
Estimated Value: $1,606,000 - $1,705,690
4
Beds
3
Baths
2,242
Sq Ft
$741/Sq Ft
Est. Value
About This Home
This home is located at 18231 Santa Sophia Cir, Fountain Valley, CA 92708 and is currently estimated at $1,661,923, approximately $741 per square foot. 18231 Santa Sophia Cir is a home located in Orange County with nearby schools including Courreges (Roch) Elementary School, Fulton (Harry C.) Middle School, and Fountain Valley High School.
Ownership History
Date
Name
Owned For
Owner Type
Purchase Details
Closed on
Jul 17, 2025
Sold by
Bergman Kenneth Aday and Hyden Julie Kay
Bought by
Bergman-Hyden Family Trust and Bergman
Current Estimated Value
Purchase Details
Closed on
Aug 2, 2005
Sold by
Gardinier Virgil E and Gardinier Donna L
Bought by
Bergman Kenneth A and Hyden Julie K
Home Financials for this Owner
Home Financials are based on the most recent Mortgage that was taken out on this home.
Original Mortgage
$359,650
Interest Rate
5.61%
Mortgage Type
Fannie Mae Freddie Mac
Purchase Details
Closed on
Aug 25, 1999
Sold by
Gardinier Virgil E and Gardinier Donna L
Bought by
Gardinier Virgil E and Gardinier Donna L
Create a Home Valuation Report for This Property
The Home Valuation Report is an in-depth analysis detailing your home's value as well as a comparison with similar homes in the area
Home Values in the Area
Average Home Value in this Area
Purchase History
| Date | Buyer | Sale Price | Title Company |
|---|---|---|---|
| Bergman-Hyden Family Trust | -- | None Listed On Document | |
| Bergman Kenneth Aday | -- | None Listed On Document | |
| Bergman Kenneth A | $890,000 | Chicago Title Co | |
| Gardinier Virgil E | -- | -- |
Source: Public Records
Mortgage History
| Date | Status | Borrower | Loan Amount |
|---|---|---|---|
| Previous Owner | Bergman Kenneth A | $359,650 |
Source: Public Records
Tax History Compared to Growth
Tax History
| Year | Tax Paid | Tax Assessment Tax Assessment Total Assessment is a certain percentage of the fair market value that is determined by local assessors to be the total taxable value of land and additions on the property. | Land | Improvement |
|---|---|---|---|---|
| 2025 | $13,242 | $1,216,119 | $993,386 | $222,733 |
| 2024 | $13,242 | $1,192,274 | $973,908 | $218,366 |
| 2023 | $11,309 | $1,017,511 | $838,396 | $179,115 |
| 2022 | $11,149 | $997,560 | $821,957 | $175,603 |
| 2021 | $10,933 | $978,000 | $805,840 | $172,160 |
| 2020 | $9,841 | $873,120 | $700,960 | $172,160 |
| 2019 | $9,637 | $856,000 | $687,215 | $168,785 |
| 2018 | $9,633 | $856,000 | $687,215 | $168,785 |
| 2017 | $9,664 | $856,000 | $687,215 | $168,785 |
| 2016 | $8,719 | $789,864 | $621,079 | $168,785 |
| 2015 | $8,587 | $778,000 | $611,750 | $166,250 |
| 2014 | $8,581 | $778,000 | $611,750 | $166,250 |
Source: Public Records
Map
Nearby Homes
- 18162 Santa Adela Cir
- 18241 Devonwood Cir
- 139 Laburnum Ln
- 18417 Mount Kristina St
- 18017 Hazel Ct
- 18566 Santa Andrea St
- 9225 Hays River Cir
- 18621 Santa Ramona St
- 106 Osprey Ln
- 201 Road Runner Ln
- 120 Laburnam Ln
- 8405 Sweetwater Cir
- 112 Parrot Ln
- 108 Pigeon Ln
- 17807 Joshua Cir
- 134 Pecan Ln
- 126 Pecan Ln
- 209 Road Runner Ln
- 127 Sumac Ln
- 109 Pigeon Ln Unit 109
- 18219 Santa Sophia Cir
- 18241 Santa Sophia Cir
- 18232 Santa Cecilia
- 18220 Santa Cecilia
- 18242 Santa Cecilia
- 18207 Santa Sophia Cir
- 18208 Santa Cecilia
- 18232 Santa Sophia Cir
- 18220 Santa Sophia Cir
- 18242 Santa Sophia Cir
- 18195 Santa Sophia Cir
- 18208 Santa Sophia Cir
- 18265 Santa Stephana Cir
- 18196 Santa Cecilia
- 18266 Santa Carlotta St
- 18196 Santa Sophia Cir
- 18185 Santa Sophia Cir
- 18231 Santa Cecilia
- 18219 Santa Cecilia
- 18231 Santa Joanana