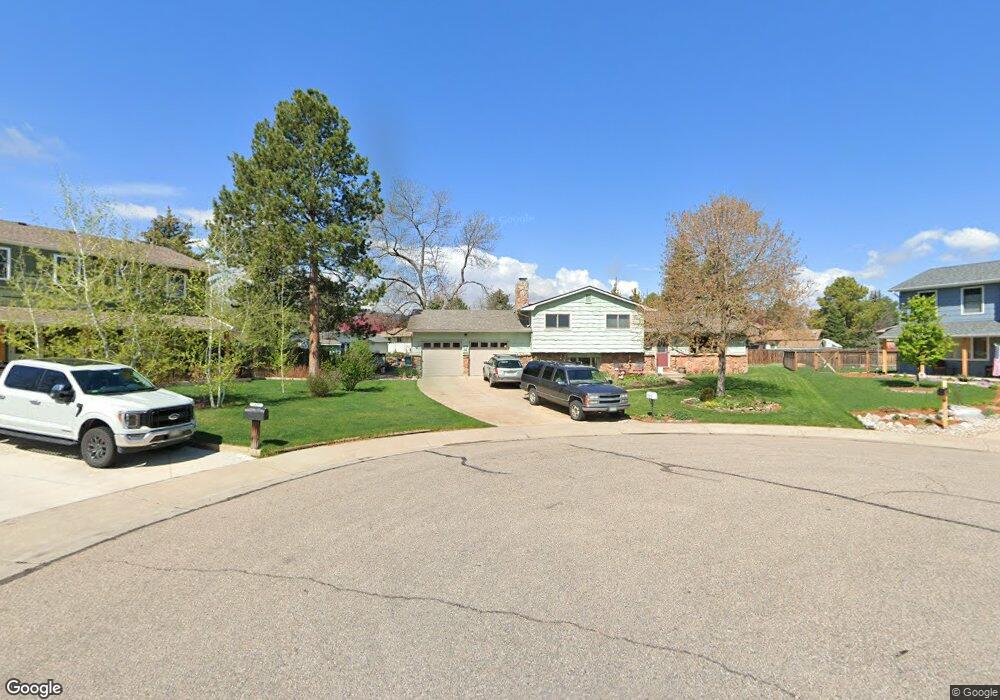
1824 Essex Dr Fort Collins, CO 80526
Estimated Value: $540,668 - $603,000
3
Beds
2
Baths
1,760
Sq Ft
$330/Sq Ft
Est. Value
About This Home
This home is located at 1824 Essex Dr, Fort Collins, CO 80526 and is currently estimated at $580,167, approximately $329 per square foot. 1824 Essex Dr is a home located in Larimer County with nearby schools including Bennett Elementary School, Blevins Middle School, and Rocky Mountain High School.
Ownership History
Date
Name
Owned For
Owner Type
Purchase Details
Closed on
Nov 23, 2016
Sold by
Hufnagel Rick R
Bought by
Hufnagel Rick R and Hufnagel Sarah
Current Estimated Value
Home Financials for this Owner
Home Financials are based on the most recent Mortgage that was taken out on this home.
Original Mortgage
$253,500
Outstanding Balance
$204,283
Interest Rate
3.54%
Mortgage Type
New Conventional
Estimated Equity
$375,884
Purchase Details
Closed on
Oct 25, 2010
Sold by
Rasmussen Sandra H and Hufnagel Rick R
Bought by
Hufnagel Rick R
Purchase Details
Closed on
Jun 13, 2001
Sold by
Dohn Sandra R
Bought by
Rasmussen Sandra H and Hufnagel Rick R
Purchase Details
Closed on
Jul 2, 1997
Sold by
Dohn David B
Bought by
Dohn Sandra R
Purchase Details
Closed on
May 1, 1994
Sold by
Evans Joan H
Bought by
Dohn Sandra R
Create a Home Valuation Report for This Property
The Home Valuation Report is an in-depth analysis detailing your home's value as well as a comparison with similar homes in the area
Home Values in the Area
Average Home Value in this Area
Purchase History
| Date | Buyer | Sale Price | Title Company |
|---|---|---|---|
| Hufnagel Rick R | -- | First American Title | |
| Hufnagel Rick R | -- | None Available | |
| Rasmussen Sandra H | -- | Land Title Guarantee Company | |
| Dohn Sandra R | -- | -- | |
| Dohn Sandra R | $134,900 | -- |
Source: Public Records
Mortgage History
| Date | Status | Borrower | Loan Amount |
|---|---|---|---|
| Open | Hufnagel Rick R | $253,500 |
Source: Public Records
Tax History Compared to Growth
Tax History
| Year | Tax Paid | Tax Assessment Tax Assessment Total Assessment is a certain percentage of the fair market value that is determined by local assessors to be the total taxable value of land and additions on the property. | Land | Improvement |
|---|---|---|---|---|
| 2025 | $2,853 | $40,120 | $3,015 | $37,105 |
| 2024 | $2,715 | $40,120 | $3,015 | $37,105 |
| 2022 | $2,047 | $28,628 | $3,128 | $25,500 |
| 2021 | $2,068 | $29,451 | $3,218 | $26,233 |
| 2020 | $2,007 | $28,601 | $3,218 | $25,383 |
| 2019 | $2,016 | $28,601 | $3,218 | $25,383 |
| 2018 | $2,340 | $25,675 | $3,240 | $22,435 |
| 2017 | $2,332 | $25,675 | $3,240 | $22,435 |
| 2016 | $2,001 | $21,914 | $3,582 | $18,332 |
| 2015 | $1,986 | $21,910 | $3,580 | $18,330 |
| 2014 | $1,691 | $18,540 | $3,580 | $14,960 |
Source: Public Records
Map
Nearby Homes
- 1701 Glenwood Dr
- 2404 Sheffield Cir E
- 2206 Rambouillet Dr
- 2420 Sheffield Cir E
- 1955 Kingsborough Dr
- 1757 Concord Dr
- 1513 Independence Rd
- 1905 Yorktown Ave
- 1854 Marlborough Ct
- 2213 Shropshire Ave
- 2613 Hanover Dr
- 2109 W Drake Rd
- 2607 S Taft Hill Rd
- 2114 Water Blossom Ln
- 1333 Village Park Ct
- 2800 S Taft Hill Rd
- 1680 Foxbrook Way
- 2001 W Prospect Rd
- 1419 Glen Haven Dr
- 2001 Evergreen Dr
- 1818 Essex Dr
- 1825 Essex Dr
- 2212 Dover Dr
- 1841 Manchester Dr
- 1845 Manchester Dr
- 2218 Dover Dr
- 2206 Dover Dr
- 1837 Manchester Dr
- 1819 Essex Dr
- 1812 Essex Dr
- 1833 Manchester Dr
- 2224 Dover Dr
- 2200 Dover Dr
- 1813 Essex Dr
- 2201 Scarborough Ct
- 1829 Manchester Dr
- 1806 Essex Dr
- 2230 Dover Dr
- 1807 Essex Dr
- 2207 Scarborough Ct