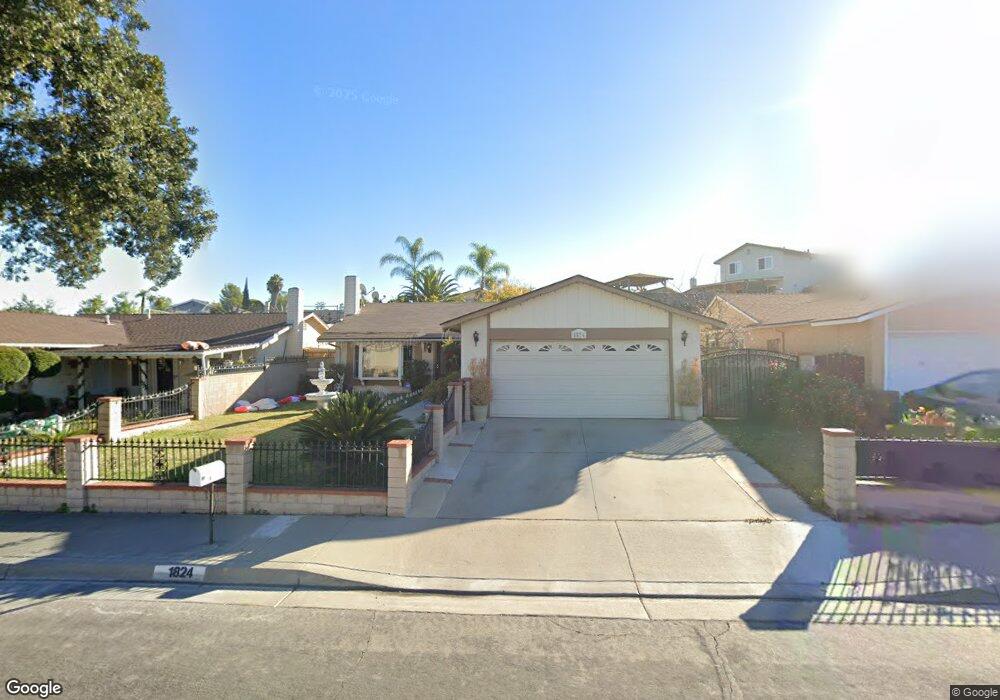
1824 Nausika Ave Rowland Heights, CA 91748
Estimated Value: $845,127 - $969,000
3
Beds
2
Baths
1,540
Sq Ft
$595/Sq Ft
Est. Value
About This Home
This home is located at 1824 Nausika Ave, Rowland Heights, CA 91748 and is currently estimated at $917,032, approximately $595 per square foot. 1824 Nausika Ave is a home located in Los Angeles County with nearby schools including Shelyn Elementary School, Alvarado Intermediate School, and John A. Rowland High School.
Ownership History
Date
Name
Owned For
Owner Type
Purchase Details
Closed on
Mar 30, 2001
Sold by
Wang Chwan Jon
Bought by
Mil Edwin R and Mil Rosalinda N
Current Estimated Value
Home Financials for this Owner
Home Financials are based on the most recent Mortgage that was taken out on this home.
Original Mortgage
$174,000
Outstanding Balance
$63,952
Interest Rate
6.98%
Estimated Equity
$853,080
Purchase Details
Closed on
Oct 29, 1998
Sold by
Chuang Joyce J
Bought by
Wang Chwan Jon and Chuang Joyce Jo Hsia
Home Financials for this Owner
Home Financials are based on the most recent Mortgage that was taken out on this home.
Original Mortgage
$135,000
Interest Rate
6.82%
Purchase Details
Closed on
Jan 10, 1994
Sold by
Chuang Joyce Jo Hsia
Bought by
Chuang Joyce Jo Hsia
Home Financials for this Owner
Home Financials are based on the most recent Mortgage that was taken out on this home.
Original Mortgage
$144,000
Interest Rate
7.38%
Create a Home Valuation Report for This Property
The Home Valuation Report is an in-depth analysis detailing your home's value as well as a comparison with similar homes in the area
Home Values in the Area
Average Home Value in this Area
Purchase History
| Date | Buyer | Sale Price | Title Company |
|---|---|---|---|
| Mil Edwin R | $217,500 | Fidelity Title | |
| Wang Chwan Jon | -- | Fidelity National Title Ins | |
| Chuang Joyce Jo Hsia | -- | Stewart Title |
Source: Public Records
Mortgage History
| Date | Status | Borrower | Loan Amount |
|---|---|---|---|
| Open | Mil Edwin R | $174,000 | |
| Previous Owner | Wang Chwan Jon | $135,000 | |
| Previous Owner | Chuang Joyce Jo Hsia | $144,000 | |
| Closed | Mil Edwin R | $32,625 |
Source: Public Records
Tax History Compared to Growth
Tax History
| Year | Tax Paid | Tax Assessment Tax Assessment Total Assessment is a certain percentage of the fair market value that is determined by local assessors to be the total taxable value of land and additions on the property. | Land | Improvement |
|---|---|---|---|---|
| 2025 | $4,901 | $369,993 | $183,219 | $186,774 |
| 2024 | $4,901 | $362,739 | $179,627 | $183,112 |
| 2023 | $4,742 | $355,627 | $176,105 | $179,522 |
| 2022 | $4,637 | $348,654 | $172,652 | $176,002 |
| 2021 | $4,557 | $341,818 | $169,267 | $172,551 |
| 2019 | $4,421 | $331,682 | $164,248 | $167,434 |
| 2018 | $4,236 | $325,179 | $161,028 | $164,151 |
| 2016 | $4,070 | $312,554 | $154,776 | $157,778 |
| 2015 | $4,005 | $307,861 | $152,452 | $155,409 |
| 2014 | $3,999 | $301,831 | $149,466 | $152,365 |
Source: Public Records
Map
Nearby Homes
- 1703 Hollandale Ave
- 1953 Camwood Ave
- 19527 Cronin Dr
- 1560 S Otterbein Ave Unit 44
- 1560 S Otterbein Ave Unit 153
- 1560 S Otterbein Ave Unit 113
- 1560 S Otterbein Ave Unit 170
- 1560 Otterbein Ave Unit 8
- 1560 Otterbein Ave Unit 12
- 1337 Brea Canyon Cutoff Rd
- 1919 Brea Canyon Cut-Off Rd
- 19717 Katrine Cir
- 18985 Radby St
- 2147 Wind River Ln
- 1816 Nowell Ave
- 2366 Pepperdale Dr
- 2189 Wind River Ln
- 19519 Greenwillow Ln
- 20043 Emerald Meadow Dr
- 1842 Bolanos Ave
- 1830 Nausika Ave
- 1818 Nausika Ave
- 1836 Nausika Ave
- 1812 Nausika Ave
- 19501 Pilario St
- 1821 Arcdale Ave
- 1815 Arcdale Ave
- 1823 Nausika Ave
- 1829 Nausika Ave
- 19507 Pilario St
- 1840 Nausika Ave
- 1819 Nausika Ave
- 1808 Nausika Ave
- 1811 Arcdale Ave
- 1835 Nausika Ave
- 1811 Nausika Ave
- 19513 Pilario St
- 1802 Nausika Ave
- 1846 Nausika Ave
- 1807 Nausika Ave