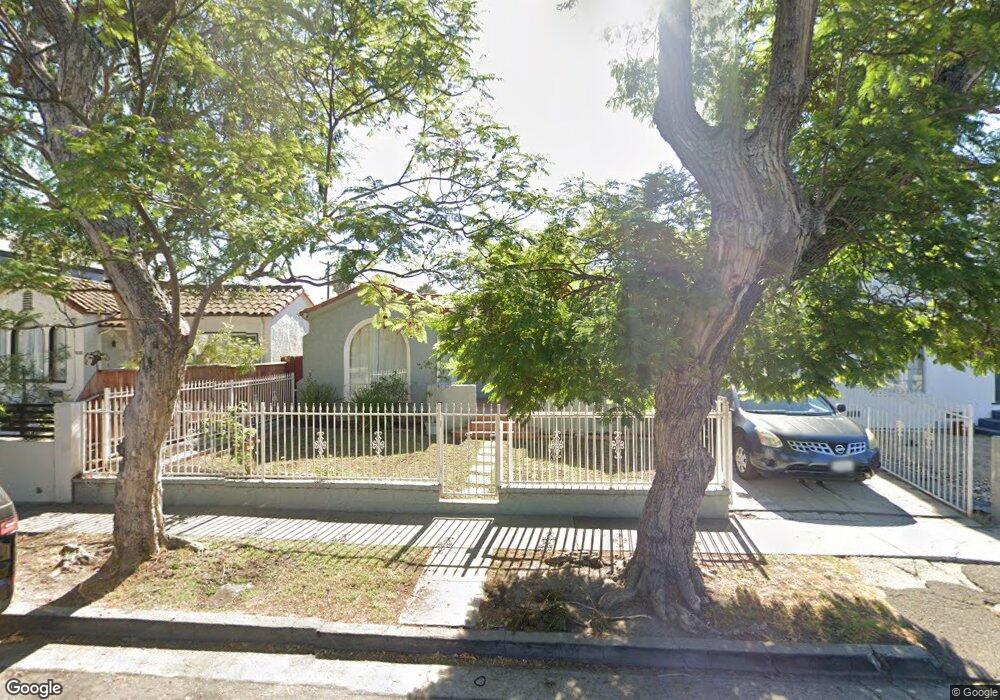
1824 S Sycamore Ave Los Angeles, CA 90019
Mid-City NeighborhoodEstimated Value: $950,000 - $1,400,000
3
Beds
2
Baths
1,724
Sq Ft
$693/Sq Ft
Est. Value
About This Home
This home is located at 1824 S Sycamore Ave, Los Angeles, CA 90019 and is currently estimated at $1,194,842, approximately $693 per square foot. 1824 S Sycamore Ave is a home located in Los Angeles County with nearby schools including Saturn Street Elementary School, Los Angeles Senior High School, and Stella Elementary Charter Academy.
Ownership History
Date
Name
Owned For
Owner Type
Purchase Details
Closed on
May 17, 2004
Sold by
Thomas Aaron Joseph
Bought by
Thomas Marilyn A and Mckenna George J
Current Estimated Value
Purchase Details
Closed on
Aug 29, 2003
Sold by
Thomas Aaron Joseph
Bought by
Thomas Aaron Joseph and Thomas Gilma Noemi
Home Financials for this Owner
Home Financials are based on the most recent Mortgage that was taken out on this home.
Original Mortgage
$80,100
Outstanding Balance
$36,698
Interest Rate
6.06%
Mortgage Type
Purchase Money Mortgage
Estimated Equity
$1,158,144
Purchase Details
Closed on
May 5, 2000
Sold by
Rodriguez Jose G
Bought by
Thomas Aaron Joseph and Thomas Gilma Noemi
Home Financials for this Owner
Home Financials are based on the most recent Mortgage that was taken out on this home.
Original Mortgage
$50,000
Interest Rate
8.15%
Create a Home Valuation Report for This Property
The Home Valuation Report is an in-depth analysis detailing your home's value as well as a comparison with similar homes in the area
Home Values in the Area
Average Home Value in this Area
Purchase History
| Date | Buyer | Sale Price | Title Company |
|---|---|---|---|
| Thomas Marilyn A | -- | -- | |
| Thomas Aaron Joseph | -- | Provident Title Company | |
| Thomas Aaron Joseph | $185,500 | Fidelity National Title Co |
Source: Public Records
Mortgage History
| Date | Status | Borrower | Loan Amount |
|---|---|---|---|
| Open | Thomas Aaron Joseph | $80,100 | |
| Closed | Thomas Aaron Joseph | $50,000 |
Source: Public Records
Tax History Compared to Growth
Tax History
| Year | Tax Paid | Tax Assessment Tax Assessment Total Assessment is a certain percentage of the fair market value that is determined by local assessors to be the total taxable value of land and additions on the property. | Land | Improvement |
|---|---|---|---|---|
| 2025 | $8,659 | $707,665 | $426,531 | $281,134 |
| 2024 | $8,659 | $693,790 | $418,168 | $275,622 |
| 2023 | $8,497 | $680,187 | $409,969 | $270,218 |
| 2022 | $8,110 | $666,851 | $401,931 | $264,920 |
| 2021 | $8,005 | $653,776 | $394,050 | $259,726 |
| 2019 | $7,769 | $634,386 | $382,363 | $252,023 |
| 2018 | $7,664 | $621,948 | $374,866 | $247,082 |
| 2016 | $7,324 | $597,799 | $360,310 | $237,489 |
| 2015 | $7,218 | $588,820 | $354,898 | $233,922 |
| 2014 | $7,248 | $577,287 | $347,947 | $229,340 |
Source: Public Records
Map
Nearby Homes
- 1858 S Orange Dr
- 1820 Alsace Ave
- 1915 1917 S Orange Dr
- 5036 Pickford St
- 1801 S Sycamore Ave
- 1861 S Redondo Blvd
- 5047 W 21st St
- 5154 W 20th St
- 4935 W 20th St
- 1623 S Sycamore Ave
- 5173 Pickford St
- 1851 S Cloverdale Ave
- 2115 S Mansfield Ave
- 5144 W 21st St
- 4901 4905 W 20th St
- 1867 S Cochran Ave
- 5227 W 20th St
- 2116 S Cloverdale Ave
- 1807 Cochran Place
- 1502 S Redondo Blvd
- 1828 S Sycamore Ave
- 1820 S Sycamore Ave
- 1814 S Sycamore Ave
- 1832 S Sycamore Ave
- 1810 S Sycamore Ave Unit 1
- 1810 S Sycamore Ave
- 1825 S Orange Dr
- 1838 S Sycamore Ave
- 1821 S Orange Dr
- 1829 S Orange Dr
- 1827 S Orange Dr
- 1819 S Sycamore Ave
- 1817 S Orange Dr
- 1825 1/2 S Orange Dr
- 1833 S Orange Dr
- 1806 S Sycamore Ave
- 1806 S Sycamore Ave
- 1821 S Sycamore Ave Unit 2
- 1821 S Sycamore Ave Unit 1
- 1821 S Sycamore Ave