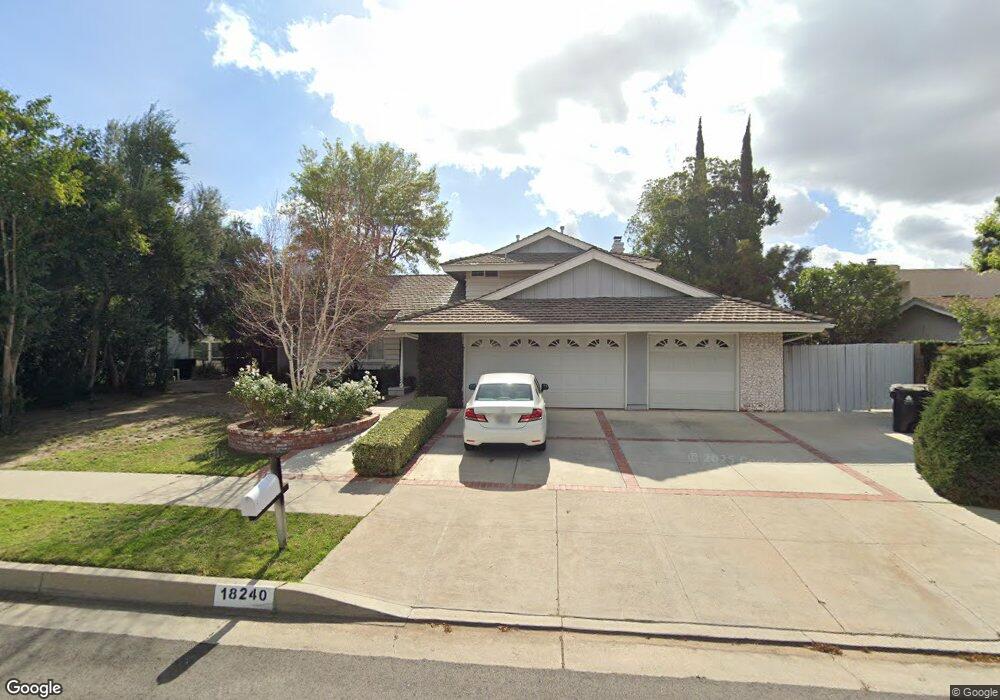
18240 Index St Porter Ranch, CA 91326
Porter Ranch NeighborhoodEstimated Value: $1,227,000 - $1,260,000
4
Beds
3
Baths
2,174
Sq Ft
$569/Sq Ft
Est. Value
About This Home
This home is located at 18240 Index St, Porter Ranch, CA 91326 and is currently estimated at $1,237,713, approximately $569 per square foot. 18240 Index St is a home located in Los Angeles County with nearby schools including Darby Avenue Elementary, Patrick Henry Middle School, and Valley Academy of Arts & Sciences.
Ownership History
Date
Name
Owned For
Owner Type
Purchase Details
Closed on
Aug 3, 2020
Sold by
Irons Charles L and Irons Misty S
Bought by
Irons Misty S
Current Estimated Value
Purchase Details
Closed on
Jul 30, 2020
Sold by
Irons Misty S
Bought by
Irons Misty S and Misty S Irons Living Trust
Purchase Details
Closed on
Oct 26, 2013
Sold by
Irons Charles Lee
Bought by
Irons Charles L and Irons Misty S
Purchase Details
Closed on
May 17, 2010
Sold by
Irons Misty Sayoko
Bought by
Irons Charles Lee and Irons Misty Sayoko
Purchase Details
Closed on
Mar 18, 2010
Sold by
Yoshikawa Thomas and Yoshikawa Catherine
Bought by
Irons Misty Sayoko
Purchase Details
Closed on
Dec 19, 2007
Sold by
Thomas Harry
Bought by
Yoshikawa Thomas
Purchase Details
Closed on
Jan 8, 1995
Sold by
Henderson Joe N
Bought by
Racimo Mario D and Racimo Amalia R
Home Financials for this Owner
Home Financials are based on the most recent Mortgage that was taken out on this home.
Original Mortgage
$161,500
Interest Rate
7.1%
Create a Home Valuation Report for This Property
The Home Valuation Report is an in-depth analysis detailing your home's value as well as a comparison with similar homes in the area
Home Values in the Area
Average Home Value in this Area
Purchase History
| Date | Buyer | Sale Price | Title Company |
|---|---|---|---|
| Irons Misty S | -- | None Available | |
| Irons Misty S | -- | None Available | |
| Irons Charles L | -- | None Available | |
| Irons Charles Lee | -- | None Available | |
| Irons Misty Sayoko | -- | None Available | |
| Yoshikawa Thomas | $650,000 | Lawyers Title | |
| Racimo Mario D | $187,000 | Landsafe Title |
Source: Public Records
Mortgage History
| Date | Status | Borrower | Loan Amount |
|---|---|---|---|
| Previous Owner | Racimo Mario D | $161,500 |
Source: Public Records
Tax History Compared to Growth
Tax History
| Year | Tax Paid | Tax Assessment Tax Assessment Total Assessment is a certain percentage of the fair market value that is determined by local assessors to be the total taxable value of land and additions on the property. | Land | Improvement |
|---|---|---|---|---|
| 2025 | $10,516 | $853,771 | $683,022 | $170,749 |
| 2024 | $10,516 | $837,031 | $669,630 | $167,401 |
| 2023 | $10,317 | $820,619 | $656,500 | $164,119 |
| 2022 | $9,844 | $804,529 | $643,628 | $160,901 |
| 2021 | $9,721 | $788,755 | $631,008 | $157,747 |
| 2019 | $9,435 | $765,362 | $612,293 | $153,069 |
| 2018 | $9,324 | $750,356 | $600,288 | $150,068 |
| 2016 | $7,300 | $586,200 | $469,200 | $117,000 |
| 2015 | $7,301 | $586,200 | $469,200 | $117,000 |
| 2014 | $6,799 | $531,000 | $425,000 | $106,000 |
Source: Public Records
Map
Nearby Homes
- 18308 Lahey St
- 18371 Lahey St
- 18351 San Fernando Mission Blvd
- 18301 Ludlow St
- 11158 Newcastle Ave
- 18352 Ludlow St
- 11410 Reseda Blvd
- 11180 Bertrand Ave
- 11325 Baird Ave
- 17916 Ludlow St
- 10861 Lindley Ave
- 11538 Zelzah Ave
- 18200 Sheffield Ln
- 11144 Viking Ave
- 17823 Rinaldi St
- 11223 White Oak Ave
- 11129 White Oak Ave
- 10811 Amigo Ave
- 18771 Clearbrook St
- 17795 Rinaldi St
- 18232 Index St
- 18248 Index St
- 18226 Index St
- 18224 Index St Unit 18226
- 18224 Index St
- 11241 Nestle Ave
- 18258 Index St
- 18233 Donmetz St
- 18241 Donmetz St
- 18243 Donmetz St
- 18225 Donmetz St
- 11240 Etiwanda Ave
- 11240 Nestle Ave
- 18249 Donmetz St
- 18216 Index St
- 11253 Nestle Ave
- 18217 Donmetz St
- 18259 Donmetz St
- 11241 Garden Grove Ave
- 11252 Etiwanda Ave