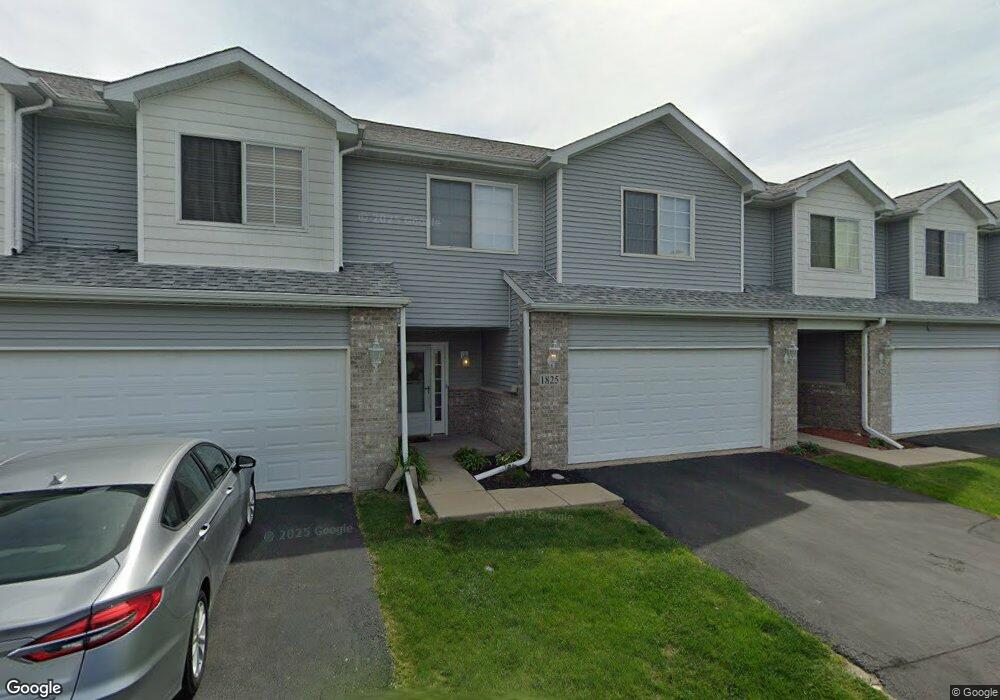
1825 Waters Edge Dr Unit 1825 Minooka, IL 60447
Estimated Value: $283,000 - $338,000
3
Beds
3
Baths
1,600
Sq Ft
$191/Sq Ft
Est. Value
About This Home
This home is located at 1825 Waters Edge Dr Unit 1825, Minooka, IL 60447 and is currently estimated at $305,721, approximately $191 per square foot. 1825 Waters Edge Dr Unit 1825 is a home located in Grundy County with nearby schools including Minooka Primary Center, Aux Sable Elementary School, and Minooka Junior High School.
Ownership History
Date
Name
Owned For
Owner Type
Purchase Details
Closed on
Aug 30, 2024
Sold by
Lewandowski Jonathan E and Lewandowski Jennifer J
Bought by
Goeing Tracy
Current Estimated Value
Home Financials for this Owner
Home Financials are based on the most recent Mortgage that was taken out on this home.
Original Mortgage
$224,000
Outstanding Balance
$221,626
Interest Rate
6.78%
Mortgage Type
New Conventional
Estimated Equity
$84,095
Purchase Details
Closed on
Apr 18, 2017
Sold by
Matos Robert A
Bought by
Lewandowski Jennifer and Lewandowski Jonathan
Home Financials for this Owner
Home Financials are based on the most recent Mortgage that was taken out on this home.
Original Mortgage
$149,246
Interest Rate
4.25%
Mortgage Type
New Conventional
Create a Home Valuation Report for This Property
The Home Valuation Report is an in-depth analysis detailing your home's value as well as a comparison with similar homes in the area
Home Values in the Area
Average Home Value in this Area
Purchase History
| Date | Buyer | Sale Price | Title Company |
|---|---|---|---|
| Goeing Tracy | $280,000 | Fidelity National Title | |
| Lewandowski Jennifer | $157,900 | Stewart Title |
Source: Public Records
Mortgage History
| Date | Status | Borrower | Loan Amount |
|---|---|---|---|
| Open | Goeing Tracy | $224,000 | |
| Previous Owner | Lewandowski Jennifer | $149,246 |
Source: Public Records
Tax History Compared to Growth
Tax History
| Year | Tax Paid | Tax Assessment Tax Assessment Total Assessment is a certain percentage of the fair market value that is determined by local assessors to be the total taxable value of land and additions on the property. | Land | Improvement |
|---|---|---|---|---|
| 2024 | $6,280 | $78,296 | $16,380 | $61,916 |
| 2023 | $5,724 | $71,366 | $14,930 | $56,436 |
| 2022 | $4,841 | $66,356 | $13,882 | $52,474 |
| 2021 | $4,628 | $62,813 | $13,141 | $49,672 |
| 2020 | $4,507 | $60,087 | $12,571 | $47,516 |
| 2019 | $4,245 | $55,636 | $11,640 | $43,996 |
| 2018 | $3,036 | $40,642 | $11,510 | $29,132 |
| 2017 | $2,936 | $38,810 | $10,991 | $27,819 |
| 2016 | $2,725 | $36,431 | $10,317 | $26,114 |
| 2015 | $2,310 | $33,116 | $9,378 | $23,738 |
| 2014 | $2,091 | $31,289 | $8,861 | $22,428 |
| 2013 | $2,152 | $31,710 | $8,980 | $22,730 |
Source: Public Records
Map
Nearby Homes
- 651 Chestnut Ridge
- 1509 Donegal Dr
- 825 Grant Dr
- 1559 Bluestem Ln
- 2080 Waters Edge Dr
- 1468 Sedge Pass
- 815 Heritage Woods Dr
- 817 Heritage Woods Dr
- 1308 Dahlgren Ln
- 27456 W Fawn Lake Ct
- 1420 Marigold Ln
- 324 Wabena Ct
- 25308 S Mallard Dr
- 1227 Wabena Ave
- 526 Lily Ct
- 300 Wabena Ct
- 27413 W Porto Ln
- 27410 W Porto Ln
- 27357 W Porto Ln
- 1138 Coneflower Ct
- 1825 Waters Edge Dr
- 1827 Waters Edge Dr
- 1819 Waters Edge Dr
- 1817 Waters Edge Dr Unit 1817
- 608 Prairie View Dr Unit 6
- 608 Prairie View Dr
- 612 Prairie View Dr
- 606 Prairie View Dr Unit 606
- 614 Prairie View Dr
- 614 Prairie View Dr Unit 4
- 602 Prairie View Dr Unit 602
- 602 Prairie View Dr
- 616 Prairie View Dr
- 604 Prairie View Dr
- 1815 Waters Edge Dr Unit 1815
- 618 Prairie View Dr
- 620 Prairie View Dr
- 1813 Waters Edge Dr Unit 1813
- 1851 Waters Edge Dr
- 1851 Waters Edge Dr Unit 1851