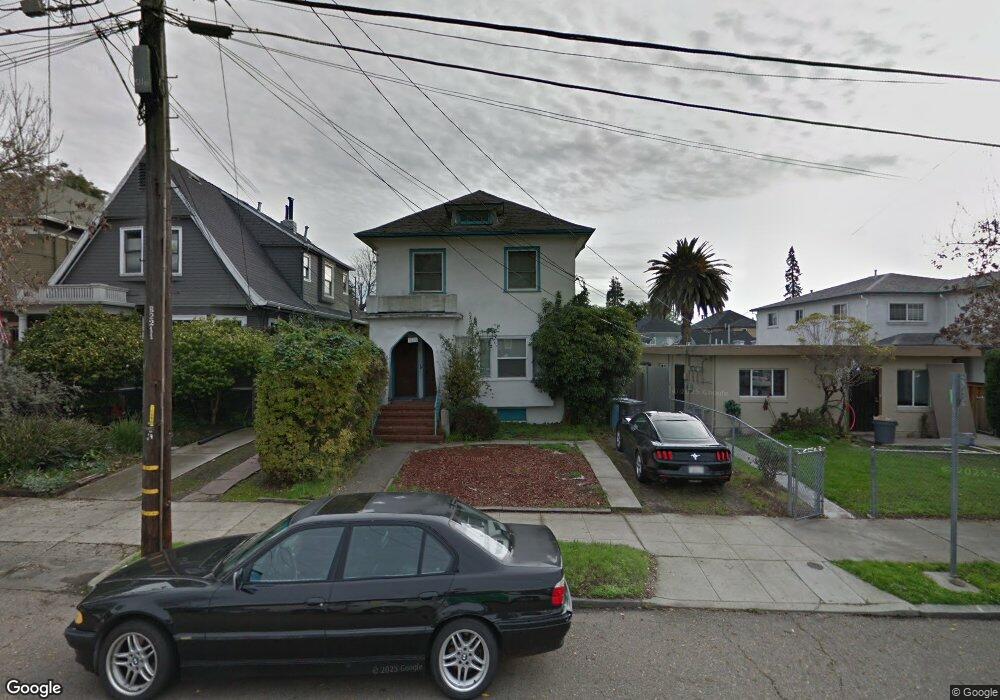
1826 62nd St Berkeley, CA 94703
South Berkeley NeighborhoodEstimated Value: $940,000 - $1,359,875
3
Beds
2
Baths
1,778
Sq Ft
$635/Sq Ft
Est. Value
About This Home
This home is located at 1826 62nd St, Berkeley, CA 94703 and is currently estimated at $1,129,719, approximately $635 per square foot. 1826 62nd St is a home located in Alameda County with nearby schools including Malcolm X Elementary School, John Muir Elementary School, and Emerson Elementary School.
Ownership History
Date
Name
Owned For
Owner Type
Purchase Details
Closed on
Dec 6, 2018
Sold by
Milligan Terry
Bought by
Essent Funding Llc
Current Estimated Value
Purchase Details
Closed on
Jul 23, 1993
Sold by
Plummer Doris
Bought by
Milligan Terry
Home Financials for this Owner
Home Financials are based on the most recent Mortgage that was taken out on this home.
Original Mortgage
$70,000
Interest Rate
6.74%
Mortgage Type
Seller Take Back
Create a Home Valuation Report for This Property
The Home Valuation Report is an in-depth analysis detailing your home's value as well as a comparison with similar homes in the area
Home Values in the Area
Average Home Value in this Area
Purchase History
| Date | Buyer | Sale Price | Title Company |
|---|---|---|---|
| Essent Funding Llc | $825,000 | First American Title Company | |
| Milligan Terry | $80,000 | -- |
Source: Public Records
Mortgage History
| Date | Status | Borrower | Loan Amount |
|---|---|---|---|
| Previous Owner | Milligan Terry | $70,000 |
Source: Public Records
Tax History
| Year | Tax Paid | Tax Assessment Tax Assessment Total Assessment is a certain percentage of the fair market value that is determined by local assessors to be the total taxable value of land and additions on the property. | Land | Improvement |
|---|---|---|---|---|
| 2025 | $16,511 | $920,287 | $529,862 | $390,425 |
| 2024 | $16,511 | $902,244 | $519,474 | $382,770 |
| 2023 | $15,700 | $884,556 | $509,290 | $375,266 |
| 2022 | $15,524 | $867,214 | $499,305 | $367,909 |
| 2021 | $15,557 | $850,212 | $489,516 | $360,696 |
| 2020 | $14,791 | $841,500 | $484,500 | $357,000 |
| 2019 | $13,926 | $825,000 | $475,000 | $350,000 |
| 2018 | $5,662 | $164,311 | $67,218 | $97,093 |
| 2017 | $5,435 | $161,089 | $65,900 | $95,189 |
| 2016 | $5,152 | $157,931 | $64,608 | $93,323 |
| 2015 | $5,045 | $155,560 | $63,638 | $91,922 |
| 2014 | $5,028 | $152,513 | $62,392 | $90,121 |
Source: Public Records
Map
Nearby Homes
- 731 60th St
- 5914 Martin Luther King jr Way
- 3233 Ellis St
- 6015 Adeline St
- 5812 Dover St
- 1627 62nd St
- 6300 Shattuck Ave Unit 1
- 667 Alcatraz Ave
- 667 & 667A Alcatraz Ave
- 6555 Shattuck Ave
- 5723 Shattuck Ave
- 912 61st St
- 914 61st St
- 558 58th St
- 3214 California St
- 5718 Adeline St
- 574 Aileen St
- 629 66th St
- 5707 Carberry Ave
- 604 56th St
Your Personal Tour Guide
Ask me questions while you tour the home.