Estimated Value: $556,000 - $744,000
4
Beds
2
Baths
2,378
Sq Ft
$282/Sq Ft
Est. Value
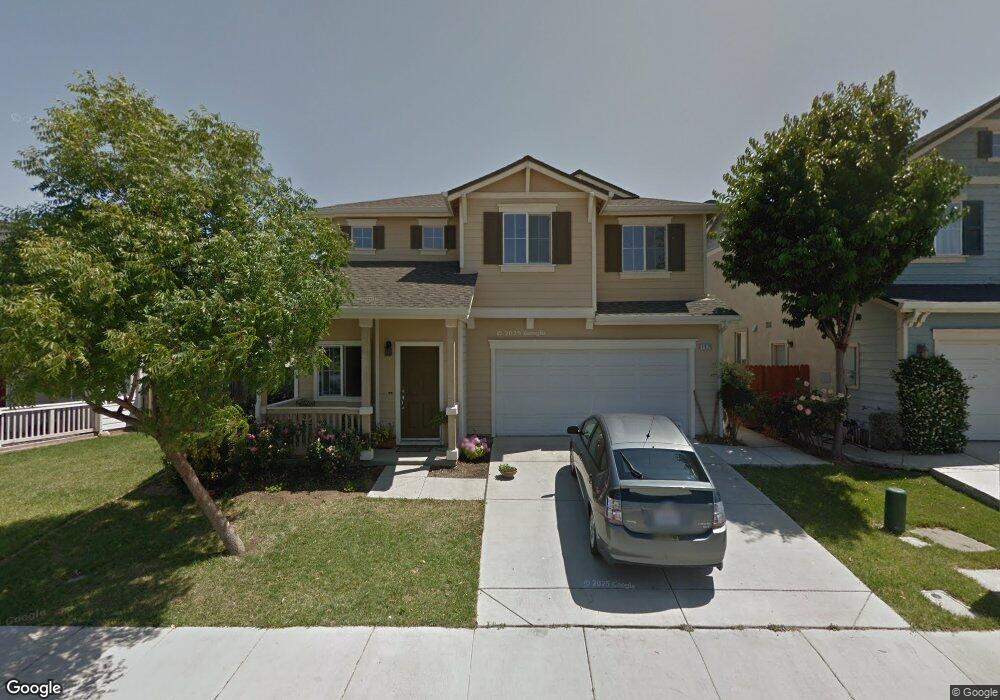
About This Home
This home is located at 1826 Calaveras Ln, Tracy, CA 95377 and is currently estimated at $669,836, approximately $281 per square foot. 1826 Calaveras Ln is a home located in San Joaquin County with nearby schools including Anthony C. Traina Elementary School, John C. Kimball High School, and Montessori Elementary & Middle School of Tracy.
Ownership History
Date
Name
Owned For
Owner Type
Purchase Details
Closed on
Mar 1, 2011
Sold by
Nakasone Mcnesby Yuko
Bought by
Mcnesby Ian L
Current Estimated Value
Home Financials for this Owner
Home Financials are based on the most recent Mortgage that was taken out on this home.
Original Mortgage
$265,590
Outstanding Balance
$182,315
Interest Rate
4.77%
Mortgage Type
VA
Estimated Equity
$487,521
Purchase Details
Closed on
Oct 18, 2010
Sold by
Suh Charleston
Bought by
California Equity Management Group Inc
Purchase Details
Closed on
Jul 19, 2006
Sold by
Suh Charleston
Bought by
Brainard Eugene and Brainard Luz Maria
Purchase Details
Closed on
Jul 9, 2003
Sold by
Western Pacific Housing Inc
Bought by
Suh Charles
Home Financials for this Owner
Home Financials are based on the most recent Mortgage that was taken out on this home.
Original Mortgage
$278,560
Interest Rate
6.75%
Mortgage Type
Purchase Money Mortgage
Create a Home Valuation Report for This Property
The Home Valuation Report is an in-depth analysis detailing your home's value as well as a comparison with similar homes in the area
Home Values in the Area
Average Home Value in this Area
Purchase History
| Date | Buyer | Sale Price | Title Company |
|---|---|---|---|
| Mcnesby Ian L | -- | Chicago Title Company | |
| Mcnesby Ian L | -- | Chicago Title Company | |
| California Equity Management Group Inc | $206,200 | None Available | |
| Brainard Eugene | -- | Fidelity National Title Co | |
| Suh Charles | $348,500 | First Amer Title Co |
Source: Public Records
Mortgage History
| Date | Status | Borrower | Loan Amount |
|---|---|---|---|
| Open | Mcnesby Ian L | $265,590 | |
| Closed | Mcnesby Ian L | $265,590 | |
| Previous Owner | Suh Charles | $278,560 | |
| Closed | Suh Charles | $69,640 |
Source: Public Records
Tax History
| Year | Tax Paid | Tax Assessment Tax Assessment Total Assessment is a certain percentage of the fair market value that is determined by local assessors to be the total taxable value of land and additions on the property. | Land | Improvement |
|---|---|---|---|---|
| 2025 | $4,845 | $333,095 | $83,271 | $249,824 |
| 2024 | $4,700 | $326,565 | $81,639 | $244,926 |
| 2023 | $4,610 | $320,163 | $80,039 | $240,124 |
| 2022 | $4,776 | $313,886 | $78,470 | $235,416 |
| 2021 | $4,687 | $307,732 | $76,932 | $230,800 |
| 2020 | $4,636 | $304,578 | $76,144 | $228,434 |
| 2019 | $4,552 | $298,606 | $74,651 | $223,955 |
| 2018 | $4,465 | $292,752 | $73,188 | $219,564 |
| 2017 | $4,364 | $287,012 | $71,753 | $215,259 |
| 2016 | $4,288 | $281,385 | $70,346 | $211,039 |
| 2014 | $4,181 | $271,731 | $67,933 | $203,798 |
Source: Public Records
Map
Nearby Homes
- 1914 Remembrance Ln
- 1531 Riverview Ave
- 1382 Windsong Dr
- 1726 White Rock Dr
- 3339 Boca Way
- 3311 Boca Way
- 3312 Boca Way
- Angora Plan at Regency at Tracy Lakes - Calero Collection
- Moraine Plan at Regency at Tracy Lakes - Calero Collection
- Burk Plan at Regency at Tracy Lakes - Pinecrest Collection
- Alpine Plan at Regency at Tracy Lakes - Echo Collection
- Triton Plan at Regency at Tracy Lakes - Pinecrest Collection
- Findley Plan at Regency at Tracy Lakes - Laguna Collection
- Martis Plan at Regency at Tracy Lakes - Laguna Collection
- Rubicon Plan at Regency at Tracy Lakes - Calero Collection
- Lucerne Plan at Regency at Tracy Lakes - Echo Collection
- Verdi Plan at Regency at Tracy Lakes - Laguna Collection
- Quigley Plan at Regency at Tracy Lakes - Pinecrest Collection
- Marabou Plan at Regency at Tracy Lakes - Pinecrest Collection
- Miramar Plan at Regency at Tracy Lakes - Echo Collection
- 1836 Calaveras Ln
- 1816 Calaveras Ln
- 4320 Burr Ct
- 1846 Calaveras Ln
- 4319 Roxbury Dr
- 1806 Calaveras Ln
- 4330 Burr Ct
- 4329 Roxbury Dr
- 1856 Calaveras Ln
- 1835 Calaveras Ln
- 1825 Calaveras Ln
- 1845 Calaveras Ln
- 1815 Calaveras Ln
- 4339 Roxbury Dr
- 4340 Burr Ct
- 1866 Calaveras Ln
- 1805 Calaveras Ln
- 1855 Calaveras Ln
- 4359 Roxbury Dr
- 4350 Burr Ct
Your Personal Tour Guide
Ask me questions while you tour the home.