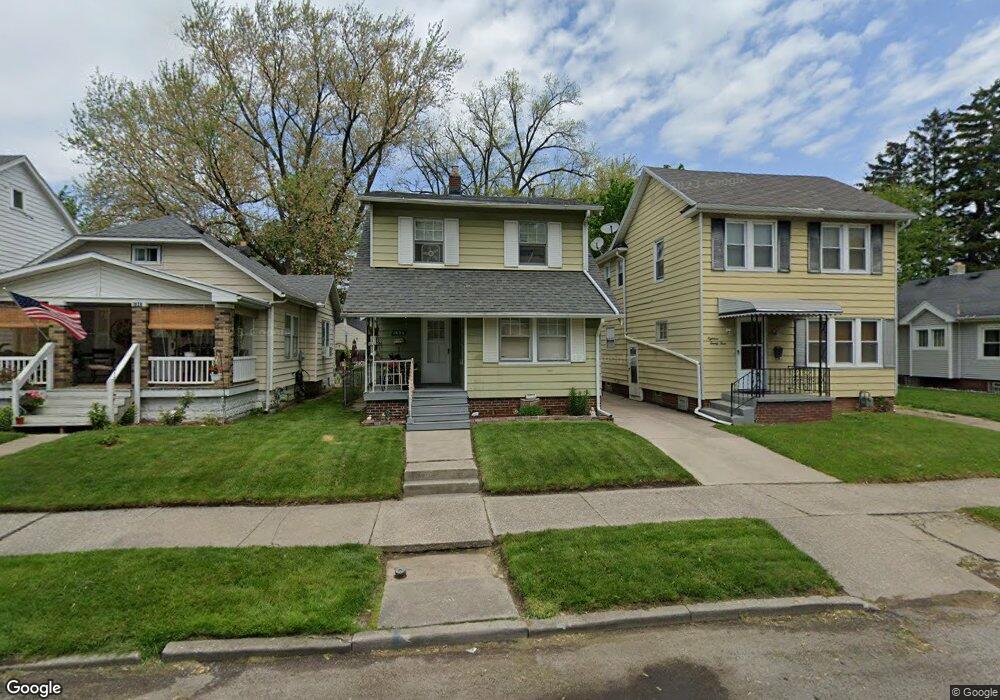
1826 Marlow Rd Toledo, OH 43613
DeVeaux NeighborhoodEstimated Value: $77,000 - $91,000
3
Beds
1
Bath
1,074
Sq Ft
$78/Sq Ft
Est. Value
About This Home
This home is located at 1826 Marlow Rd, Toledo, OH 43613 and is currently estimated at $83,562, approximately $77 per square foot. 1826 Marlow Rd is a home located in Lucas County with nearby schools including McKinley Stemm Academy, Start High School, and Hope Learning Academy of Toledo.
Ownership History
Date
Name
Owned For
Owner Type
Purchase Details
Closed on
Aug 14, 2017
Sold by
Usa Regrowth Llc
Bought by
Pass Josh
Current Estimated Value
Purchase Details
Closed on
Oct 15, 2010
Sold by
Private Contract Administration Llc
Bought by
Chabra Rakesh
Purchase Details
Closed on
Oct 11, 2010
Sold by
Moody James and Moody Cheryl
Bought by
Private Contract Administration Llc
Purchase Details
Closed on
Jul 30, 2010
Sold by
Federal Home Loan Mortgage Corporation
Bought by
Moody James
Purchase Details
Closed on
Feb 23, 2010
Sold by
Young Joshua A
Bought by
Federal Home Loan Mortgage Corp
Purchase Details
Closed on
Feb 13, 2001
Sold by
Kelly Kelly D and Kelly A M
Bought by
Young Joshua and Young Trista
Home Financials for this Owner
Home Financials are based on the most recent Mortgage that was taken out on this home.
Original Mortgage
$69,000
Interest Rate
7.1%
Create a Home Valuation Report for This Property
The Home Valuation Report is an in-depth analysis detailing your home's value as well as a comparison with similar homes in the area
Home Values in the Area
Average Home Value in this Area
Purchase History
| Date | Buyer | Sale Price | Title Company |
|---|---|---|---|
| Pass Josh | $49,900 | All Point Title | |
| Chabra Rakesh | $38,000 | None Available | |
| Private Contract Administration Llc | -- | None Available | |
| Moody James | $20,000 | Attorney | |
| Federal Home Loan Mortgage Corp | $36,667 | None Available | |
| Young Joshua | $69,000 | -- |
Source: Public Records
Mortgage History
| Date | Status | Borrower | Loan Amount |
|---|---|---|---|
| Previous Owner | Young Joshua | $69,000 |
Source: Public Records
Tax History Compared to Growth
Tax History
| Year | Tax Paid | Tax Assessment Tax Assessment Total Assessment is a certain percentage of the fair market value that is determined by local assessors to be the total taxable value of land and additions on the property. | Land | Improvement |
|---|---|---|---|---|
| 2024 | -- | $22,785 | $5,320 | $17,465 |
| 2023 | $984 | $14,700 | $3,675 | $11,025 |
| 2022 | $987 | $14,700 | $3,675 | $11,025 |
| 2021 | $1,011 | $14,700 | $3,675 | $11,025 |
| 2020 | $1,088 | $14,070 | $3,500 | $10,570 |
| 2019 | $1,058 | $14,070 | $3,500 | $10,570 |
| 2018 | $532 | $14,070 | $3,500 | $10,570 |
| 2017 | $1,090 | $13,755 | $3,430 | $10,325 |
| 2016 | $1,090 | $39,300 | $9,800 | $29,500 |
| 2015 | $1,081 | $39,300 | $9,800 | $29,500 |
| 2014 | $889 | $13,760 | $3,430 | $10,330 |
| 2013 | $889 | $13,760 | $3,430 | $10,330 |
Source: Public Records
Map
Nearby Homes
- 3430 Upton Ave
- 1822 Wychwood St
- 1929 Marlow Rd
- 1759 Talbot St
- 1735 Wychwood St
- 1840 Talbot St
- 1952 Fairfax Rd
- 1747 Duncan Rd
- 1820 Marne Ave
- 1935 Talbot St
- 1814 Balkan Place
- 1846 Balkan Place
- 1815 Berdan Ave
- 1939 Balkan Place
- 1749 Berdan Ave
- 1834 Berdan Ave
- 2040 Fairfax Rd
- 1751 Georgia Ave
- 2045 Fairfax Rd
- 1741 Barrows St
- 1824 Marlow Rd
- 1828 Marlow Rd
- 1820 Marlow Rd
- 1832 Marlow Rd
- 1838 Marlow Rd
- 1816 Marlow Rd
- 1834 Marlow Rd
- 1825 Mansfield Rd
- 1823 Mansfield Rd
- 1829 Mansfield Rd
- 1821 Mansfield Rd
- 1833 Mansfield Rd
- 1823 Marlow Rd
- 1829 Marlow Rd
- 1837 Mansfield Rd
- 1817 Marlow Rd
- 1842 Marlow Rd
- 1833 Marlow Rd
- 1839 Marlow Rd
- 1808 Marlow Rd