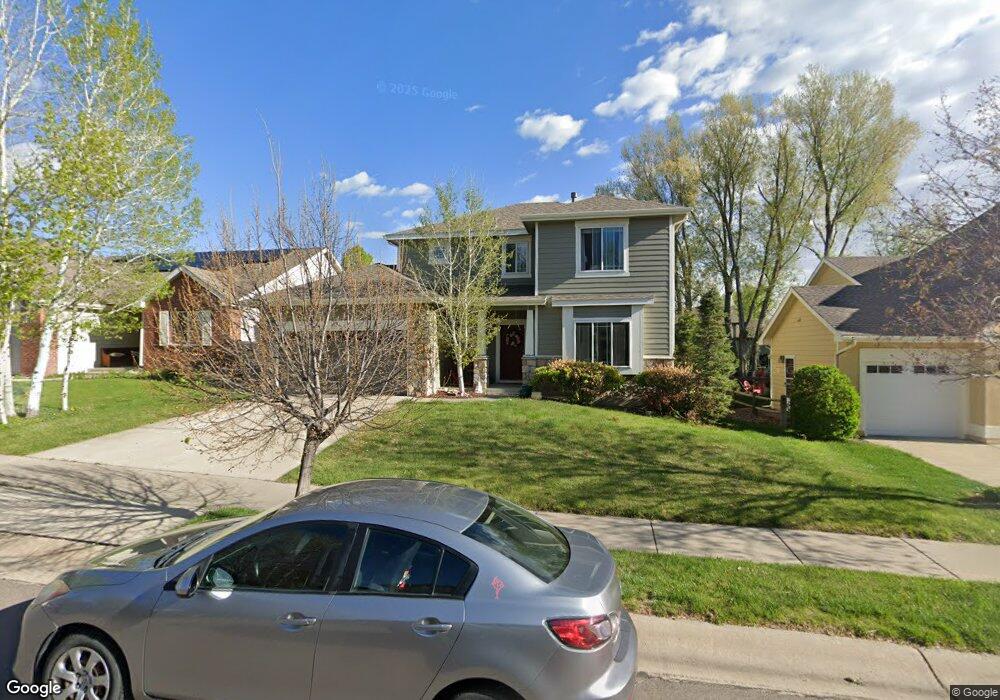
1826 Thyme Ct Fort Collins, CO 80528
Estimated Value: $549,321 - $637,000
3
Beds
3
Baths
1,926
Sq Ft
$316/Sq Ft
Est. Value
About This Home
This home is located at 1826 Thyme Ct, Fort Collins, CO 80528 and is currently estimated at $607,830, approximately $315 per square foot. 1826 Thyme Ct is a home located in Larimer County with nearby schools including Kruse Elementary School, Boltz Middle School, and Fort Collins High School.
Ownership History
Date
Name
Owned For
Owner Type
Purchase Details
Closed on
Jan 14, 2008
Sold by
Bellendir Joshua G and Bellendir Lisa Mae
Bought by
Faurie Marie Helene
Current Estimated Value
Home Financials for this Owner
Home Financials are based on the most recent Mortgage that was taken out on this home.
Original Mortgage
$74,000
Outstanding Balance
$46,686
Interest Rate
6.15%
Mortgage Type
Purchase Money Mortgage
Estimated Equity
$561,144
Purchase Details
Closed on
Aug 13, 2001
Sold by
Classic Custom Builders Inc
Bought by
Bellendir Joshua G and Bellendir Lisa Mae
Home Financials for this Owner
Home Financials are based on the most recent Mortgage that was taken out on this home.
Original Mortgage
$187,750
Interest Rate
7.07%
Create a Home Valuation Report for This Property
The Home Valuation Report is an in-depth analysis detailing your home's value as well as a comparison with similar homes in the area
Home Values in the Area
Average Home Value in this Area
Purchase History
| Date | Buyer | Sale Price | Title Company |
|---|---|---|---|
| Faurie Marie Helene | $274,000 | Guardian Title Agency Llc | |
| Bellendir Joshua G | $220,517 | -- |
Source: Public Records
Mortgage History
| Date | Status | Borrower | Loan Amount |
|---|---|---|---|
| Open | Faurie Marie Helene | $74,000 | |
| Previous Owner | Bellendir Joshua G | $187,750 |
Source: Public Records
Tax History Compared to Growth
Tax History
| Year | Tax Paid | Tax Assessment Tax Assessment Total Assessment is a certain percentage of the fair market value that is determined by local assessors to be the total taxable value of land and additions on the property. | Land | Improvement |
|---|---|---|---|---|
| 2025 | $3,319 | $38,277 | $3,752 | $34,525 |
| 2024 | $3,158 | $38,277 | $3,752 | $34,525 |
| 2022 | $2,579 | $27,314 | $3,892 | $23,422 |
| 2021 | $2,606 | $28,100 | $4,004 | $24,096 |
| 2020 | $2,434 | $26,019 | $4,004 | $22,015 |
| 2019 | $2,445 | $26,019 | $4,004 | $22,015 |
| 2018 | $2,245 | $24,638 | $4,032 | $20,606 |
| 2017 | $2,238 | $24,638 | $4,032 | $20,606 |
| 2016 | $2,203 | $24,135 | $4,458 | $19,677 |
| 2015 | $2,187 | $24,140 | $4,460 | $19,680 |
| 2014 | $1,979 | $21,700 | $4,460 | $17,240 |
Source: Public Records
Map
Nearby Homes
- 5225 White Willow Dr Unit F200
- 5225 White Willow Dr Unit N210
- 5225 White Willow Dr Unit J110
- 2055 Angelo Dr
- 1715 Globe Ct
- 5121 Stillwater Creek Dr Unit B
- 2107 Stillwater Creek Dr
- 2138 Copper Creek Dr Unit B
- 2142 Stetson Creek Dr
- 5502 Weeping Way
- 2208 Copper Creek Dr Unit A
- 2120 Timber Creek Dr Unit H4
- 2120 Timber Creek Dr Unit K1
- 4751 Pleasant Oak Dr Unit C83
- 4751 Pleasant Oak Dr Unit C65
- 1313 Silk Oak Dr
- 4913 Smallwood Ct
- 5125 Redbud Ct
- 1632 Happy Woodland Dr
- 1626 Happy Woodland Dr