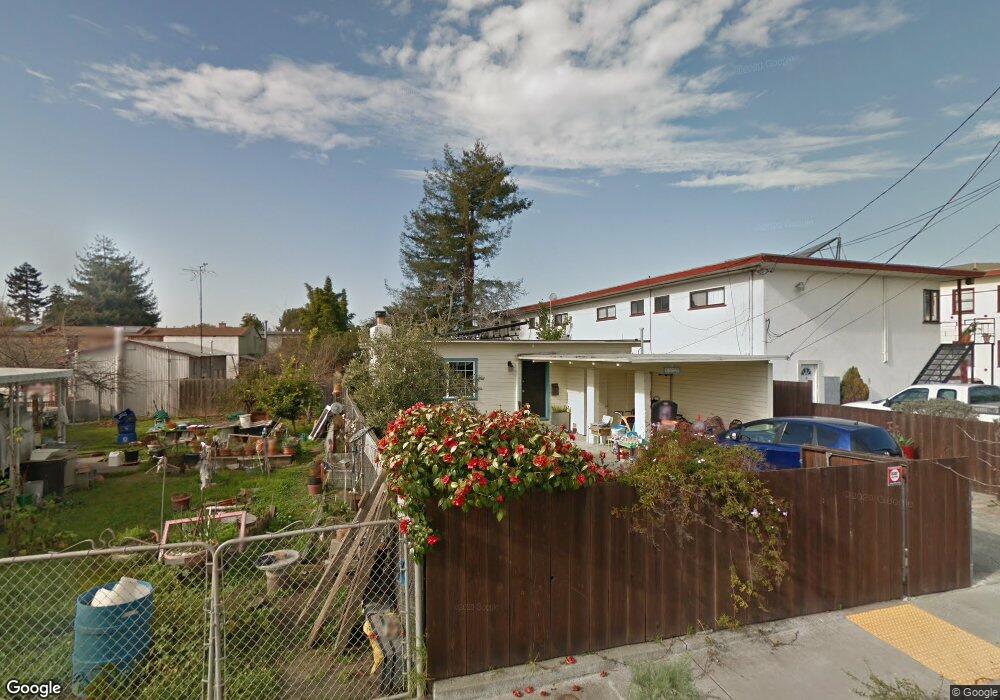
1826 West St Berkeley, CA 94702
West Berkeley NeighborhoodEstimated Value: $1,309,039 - $1,632,000
2
Beds
1
Bath
1,080
Sq Ft
$1,370/Sq Ft
Est. Value
About This Home
This home is located at 1826 West St, Berkeley, CA 94702 and is currently estimated at $1,480,010, approximately $1,370 per square foot. 1826 West St is a home located in Alameda County with nearby schools including Ruth Acty Elementary, Rosa Parks Elementary School, and Berkeley Arts Magnet at Whittier School.
Ownership History
Date
Name
Owned For
Owner Type
Purchase Details
Closed on
Jul 21, 2015
Sold by
Miller Cynthia J and Doan Jennifer D
Bought by
Kokel David and Bradley Amber
Current Estimated Value
Home Financials for this Owner
Home Financials are based on the most recent Mortgage that was taken out on this home.
Original Mortgage
$540,000
Outstanding Balance
$423,255
Interest Rate
4.01%
Mortgage Type
New Conventional
Estimated Equity
$1,056,755
Purchase Details
Closed on
Dec 1, 2009
Sold by
Dunn Michael S and Faraone Robyn E
Bought by
Miller Cynthia J and Doan Jennifer D
Purchase Details
Closed on
Aug 27, 2002
Sold by
Ceasar Willie James and Andrew Moore Trust
Bought by
Dunn Michael S and Faraone Robyn E
Home Financials for this Owner
Home Financials are based on the most recent Mortgage that was taken out on this home.
Original Mortgage
$281,600
Interest Rate
6.29%
Purchase Details
Closed on
Nov 20, 2001
Sold by
Moore Andrew
Bought by
Moore Andrew and The Andrew Moore Trust
Create a Home Valuation Report for This Property
The Home Valuation Report is an in-depth analysis detailing your home's value as well as a comparison with similar homes in the area
Home Values in the Area
Average Home Value in this Area
Purchase History
| Date | Buyer | Sale Price | Title Company |
|---|---|---|---|
| Kokel David | $865,000 | Chicago Title Company | |
| Miller Cynthia J | $525,000 | Chicago Title Company | |
| Dunn Michael S | $352,000 | Old Republic Title Company | |
| Moore Andrew | -- | -- |
Source: Public Records
Mortgage History
| Date | Status | Borrower | Loan Amount |
|---|---|---|---|
| Open | Kokel David | $540,000 | |
| Previous Owner | Dunn Michael S | $281,600 |
Source: Public Records
Tax History
| Year | Tax Paid | Tax Assessment Tax Assessment Total Assessment is a certain percentage of the fair market value that is determined by local assessors to be the total taxable value of land and additions on the property. | Land | Improvement |
|---|---|---|---|---|
| 2025 | $14,240 | $1,016,960 | $307,188 | $716,772 |
| 2024 | $14,240 | $996,884 | $301,165 | $702,719 |
| 2023 | $13,959 | $984,204 | $295,261 | $688,943 |
| 2022 | $13,742 | $957,907 | $289,472 | $675,435 |
| 2021 | $13,795 | $938,988 | $283,796 | $662,192 |
| 2020 | $13,146 | $936,292 | $280,887 | $655,405 |
| 2019 | $12,727 | $917,937 | $275,381 | $642,556 |
| 2018 | $12,534 | $899,945 | $269,983 | $629,962 |
| 2017 | $12,098 | $882,300 | $264,690 | $617,610 |
| 2016 | $11,793 | $865,000 | $259,500 | $605,500 |
| 2015 | $8,108 | $563,854 | $169,156 | $394,698 |
| 2014 | $8,056 | $552,814 | $165,844 | $386,970 |
Source: Public Records
Map
Nearby Homes
- 1322 Virginia St
- 1919 Curtis St
- 1411 Hearst Ave Unit 2
- 1207 Francisco St
- 1207 Francisco St Unit 2
- 1728 Curtis St
- 1436 Delaware St
- 1128 Delaware St
- 1813 Sacramento St
- 1512 Hearst Ave Unit 1512
- 1482 Lincoln St
- 1609 Kains Ave
- 1564 Sacramento St
- 2118 California St
- 2231 Byron St
- 940 Delaware St
- 1450 Curtis St
- 2304 Edwards St
- 998 Virginia St
- 2324 Browning St
- 1295 Hearst Ave
- 1299 Hearst Ave
- 1285 Hearst Ave
- 1277 Hearst Ave
- 1274 Delaware St
- 1275 Hearst Ave
- 1300 Delaware St
- 1301 Hearst Ave
- 1276 Delaware St
- 1274A Delaware St
- 1292 Delaware St
- 1280 Delaware St
- 1273 Hearst Ave
- 1290 Delaware St
- 1272 Delaware St
- 1284 Hearst Ave
- 1284 Hearst Ave Unit B
- 1284 Hearst Ave
- 1278 Delaware St
- 1337 Hearst Ave
Your Personal Tour Guide
Ask me questions while you tour the home.