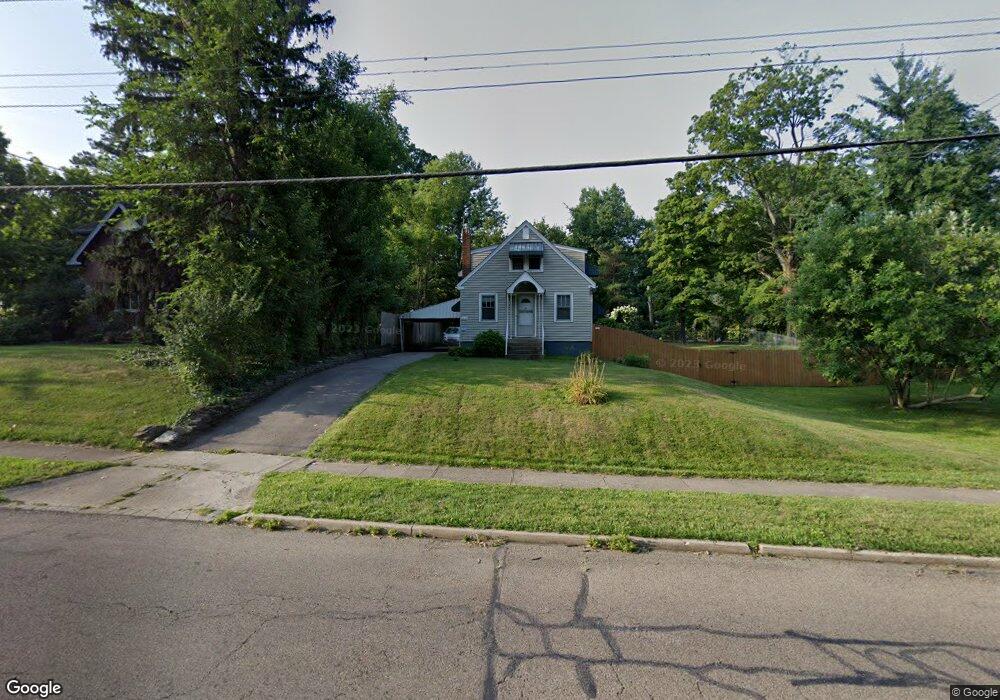
1827 Adams Rd Cincinnati, OH 45231
Estimated Value: $187,719 - $222,000
3
Beds
2
Baths
1,249
Sq Ft
$163/Sq Ft
Est. Value
About This Home
This home is located at 1827 Adams Rd, Cincinnati, OH 45231 and is currently estimated at $203,430, approximately $162 per square foot. 1827 Adams Rd is a home located in Hamilton County with nearby schools including Mt Healthy High School and Central Montessori Academy.
Ownership History
Date
Name
Owned For
Owner Type
Purchase Details
Closed on
Apr 27, 2007
Sold by
Menon Dhanalakshmi and Menon Gireesan
Bought by
Nelliot Mohandas Thouduvayil and Pullanikad Sudha
Current Estimated Value
Home Financials for this Owner
Home Financials are based on the most recent Mortgage that was taken out on this home.
Original Mortgage
$70,000
Outstanding Balance
$42,649
Interest Rate
6.2%
Mortgage Type
Unknown
Estimated Equity
$160,782
Purchase Details
Closed on
Mar 15, 2002
Sold by
Gireesan Menon
Bought by
Menon Gireesan and Menon Dhanalakshmi
Purchase Details
Closed on
Jan 1, 2001
Sold by
Wolf Investment Group Llc
Bought by
Clovernook Real Estate Holding Co Llc
Purchase Details
Closed on
Apr 25, 1994
Sold by
Hood Michael D and Hood Robin A Stark
Bought by
Menon Gireesan
Create a Home Valuation Report for This Property
The Home Valuation Report is an in-depth analysis detailing your home's value as well as a comparison with similar homes in the area
Home Values in the Area
Average Home Value in this Area
Purchase History
| Date | Buyer | Sale Price | Title Company |
|---|---|---|---|
| Nelliot Mohandas Thouduvayil | -- | Attorney | |
| Nelliot Mohandas Thoduvayil | $95,000 | Attorney | |
| Menon Gireesan | -- | -- | |
| Clovernook Real Estate Holding Co Llc | $600,000 | -- | |
| Menon Gireesan | -- | -- |
Source: Public Records
Mortgage History
| Date | Status | Borrower | Loan Amount |
|---|---|---|---|
| Open | Nelliot Mohandas Thouduvayil | $70,000 |
Source: Public Records
Tax History Compared to Growth
Tax History
| Year | Tax Paid | Tax Assessment Tax Assessment Total Assessment is a certain percentage of the fair market value that is determined by local assessors to be the total taxable value of land and additions on the property. | Land | Improvement |
|---|---|---|---|---|
| 2024 | $2,411 | $46,225 | $10,129 | $36,096 |
| 2023 | $2,432 | $46,225 | $10,129 | $36,096 |
| 2022 | $2,125 | $28,907 | $9,940 | $18,967 |
| 2021 | $2,073 | $28,907 | $9,940 | $18,967 |
| 2020 | $2,128 | $28,907 | $9,940 | $18,967 |
| 2019 | $1,786 | $25,582 | $8,796 | $16,786 |
| 2018 | $1,798 | $25,582 | $8,796 | $16,786 |
| 2017 | $1,696 | $25,582 | $8,796 | $16,786 |
| 2016 | $1,681 | $25,036 | $8,110 | $16,926 |
| 2015 | $1,692 | $25,036 | $8,110 | $16,926 |
| 2014 | $1,682 | $25,036 | $8,110 | $16,926 |
| 2013 | $1,892 | $28,449 | $9,216 | $19,233 |
Source: Public Records
Map
Nearby Homes
- 1737 Compton Rd
- 1559 Adams Rd
- 7428 Werner Ave
- 9124 Ranchill Dr
- 7355 Werner Ave
- 1541 Mcmakin Ave
- 1579 Meredith Dr
- 9648 Fallshill Cir
- 7617 Elizabeth St
- 1514 Compton Rd
- 1559 Meredith Dr
- 2204 Woodacre Dr
- 7400 Hickman St
- 7508 Elizabeth St
- 7504 Elizabeth St
- 7345 Hickman St
- 7212 Park Ave
- 2317 Garrison Dr
- 2358 Woodbluff Ct
- 2317 Magdalena Dr