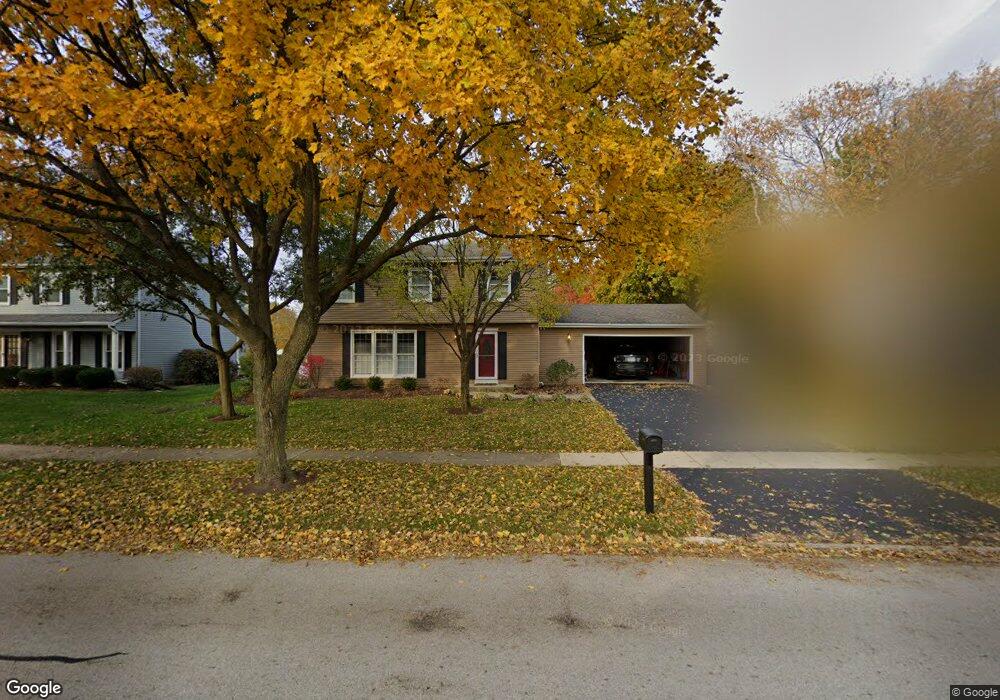
1827 Fairoak Rd Naperville, IL 60565
Signal Point NeighborhoodEstimated Value: $437,000 - $533,463
4
Beds
3
Baths
1,836
Sq Ft
$269/Sq Ft
Est. Value
About This Home
This home is located at 1827 Fairoak Rd, Naperville, IL 60565 and is currently estimated at $493,366, approximately $268 per square foot. 1827 Fairoak Rd is a home located in DuPage County with nearby schools including Scott Elementary School, Madison Jr High School, and Naperville Central High School.
Ownership History
Date
Name
Owned For
Owner Type
Purchase Details
Closed on
Dec 9, 2015
Sold by
Lesch Justin H and Lesch Amy E
Bought by
Sandra Yore Bogusevic Trust
Current Estimated Value
Purchase Details
Closed on
Aug 26, 2010
Sold by
Lesch Justin H and Lesch Amy E
Bought by
Lesch Justin H and Lesch Amy E
Home Financials for this Owner
Home Financials are based on the most recent Mortgage that was taken out on this home.
Original Mortgage
$307,634
Interest Rate
4.25%
Mortgage Type
FHA
Purchase Details
Closed on
May 21, 2009
Sold by
Vass Russell H and Russell H Vass Jr Trust
Bought by
Lesch Justin H and Mayer Amy E
Home Financials for this Owner
Home Financials are based on the most recent Mortgage that was taken out on this home.
Original Mortgage
$304,385
Interest Rate
4.85%
Mortgage Type
FHA
Create a Home Valuation Report for This Property
The Home Valuation Report is an in-depth analysis detailing your home's value as well as a comparison with similar homes in the area
Home Values in the Area
Average Home Value in this Area
Purchase History
| Date | Buyer | Sale Price | Title Company |
|---|---|---|---|
| Sandra Yore Bogusevic Trust | $350,000 | Multiple | |
| Lesch Justin H | -- | Specialty Title Services | |
| Lesch Justin H | $310,000 | Multiple |
Source: Public Records
Mortgage History
| Date | Status | Borrower | Loan Amount |
|---|---|---|---|
| Previous Owner | Lesch Justin H | $307,634 | |
| Previous Owner | Lesch Justin H | $304,385 |
Source: Public Records
Tax History Compared to Growth
Tax History
| Year | Tax Paid | Tax Assessment Tax Assessment Total Assessment is a certain percentage of the fair market value that is determined by local assessors to be the total taxable value of land and additions on the property. | Land | Improvement |
|---|---|---|---|---|
| 2024 | $8,878 | $144,917 | $69,566 | $75,351 |
| 2023 | $8,074 | $132,260 | $63,490 | $68,770 |
| 2022 | $7,733 | $125,490 | $60,240 | $65,250 |
| 2021 | $7,448 | $120,740 | $57,960 | $62,780 |
| 2020 | $7,288 | $118,570 | $56,920 | $61,650 |
| 2019 | $7,072 | $113,440 | $54,460 | $58,980 |
| 2018 | $7,074 | $113,440 | $54,460 | $58,980 |
| 2017 | $6,929 | $109,610 | $52,620 | $56,990 |
| 2016 | $6,787 | $105,650 | $50,720 | $54,930 |
| 2015 | $6,739 | $99,490 | $47,760 | $51,730 |
| 2014 | $6,767 | $96,920 | $45,700 | $51,220 |
| 2013 | $6,666 | $97,150 | $45,810 | $51,340 |
Source: Public Records
Map
Nearby Homes
- 517 Sheffield Rd
- 816 Spindletree Ave
- 621 Bourbon Ct
- 1717 Drake Ct
- 456 Timber Trail Ct
- 431 Orleans Ave
- 805 Potomac Ave
- 1340 Auburn Ave
- 1323 Auburn Ave
- 336 Brooklea Ct
- 2230 Keim Rd Unit 3B
- 705 Potomac Ave
- 158 E Bailey Rd Unit F
- 144 E Bailey Rd Unit L
- 138 E Bailey Rd Unit M
- 302 Carriage Hill Rd
- 128 E Bailey Rd Unit G
- 1704 Kenyon Dr
- 1751 S Washington St Unit 1
- 1449 Whitespire Ct Unit 5104
- 1831 Fairoak Rd
- 1823 Fairoak Rd
- 1835 Fairoak Rd
- 1822 Deerpath Ct
- 1819 Fairoak Rd
- 1832 Fairoak Rd
- 1826 Deerpath Ct
- 1839 Fairoak Rd
- 1818 Deerpath Ct
- 1828 Leabrook Ct
- 1832 Leabrook Ct
- 1836 Fairoak Rd
- 1815 Fairoak Rd
- 1843 Fairoak Rd
- 1840 Fairoak Rd
- 1836 Leabrook Ct
- 1814 Deerpath Ct
- 1827 Deerpath Ct
- 1821 Sunrise Ct
- 1811 Fairoak Rd