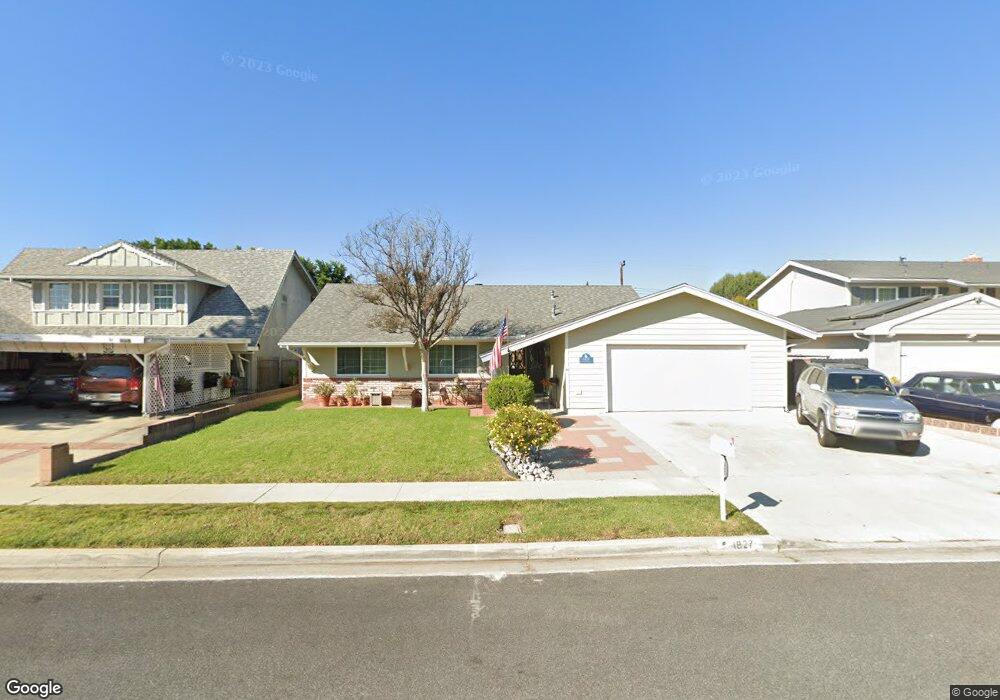
1827 Fred Ave Simi Valley, CA 93065
Central Simi Valley NeighborhoodEstimated Value: $768,403 - $817,000
3
Beds
2
Baths
1,465
Sq Ft
$538/Sq Ft
Est. Value
About This Home
This home is located at 1827 Fred Ave, Simi Valley, CA 93065 and is currently estimated at $788,351, approximately $538 per square foot. 1827 Fred Ave is a home located in Ventura County with nearby schools including Berylwood Elementary School, Hillside Middle School, and Royal High School.
Ownership History
Date
Name
Owned For
Owner Type
Purchase Details
Closed on
Mar 21, 2000
Sold by
Martinelli Bradley L
Bought by
Bunge Duane D and Bunge Jana L
Current Estimated Value
Home Financials for this Owner
Home Financials are based on the most recent Mortgage that was taken out on this home.
Original Mortgage
$206,299
Outstanding Balance
$69,716
Interest Rate
8.25%
Mortgage Type
FHA
Estimated Equity
$718,635
Create a Home Valuation Report for This Property
The Home Valuation Report is an in-depth analysis detailing your home's value as well as a comparison with similar homes in the area
Home Values in the Area
Average Home Value in this Area
Purchase History
| Date | Buyer | Sale Price | Title Company |
|---|---|---|---|
| Bunge Duane D | $208,000 | Chicago Title Co |
Source: Public Records
Mortgage History
| Date | Status | Borrower | Loan Amount |
|---|---|---|---|
| Open | Bunge Duane D | $206,299 | |
| Closed | Bunge Duane D | $12,480 |
Source: Public Records
Tax History Compared to Growth
Tax History
| Year | Tax Paid | Tax Assessment Tax Assessment Total Assessment is a certain percentage of the fair market value that is determined by local assessors to be the total taxable value of land and additions on the property. | Land | Improvement |
|---|---|---|---|---|
| 2025 | $4,148 | $319,657 | $127,860 | $191,797 |
| 2024 | $4,148 | $313,390 | $125,353 | $188,037 |
| 2023 | $3,897 | $307,246 | $122,896 | $184,350 |
| 2022 | $3,864 | $301,222 | $120,486 | $180,736 |
| 2021 | $3,820 | $295,316 | $118,123 | $177,193 |
| 2020 | $3,731 | $292,290 | $116,913 | $175,377 |
| 2019 | $3,558 | $286,560 | $114,621 | $171,939 |
| 2018 | $3,517 | $280,942 | $112,374 | $168,568 |
| 2017 | $3,431 | $275,434 | $110,171 | $165,263 |
| 2016 | $3,273 | $270,034 | $108,011 | $162,023 |
| 2015 | $3,195 | $265,981 | $106,390 | $159,591 |
| 2014 | $3,140 | $260,773 | $104,307 | $156,466 |
Source: Public Records
Map
Nearby Homes
- 2149 Madrone St
- 2783 Fallon Cir
- 2349 Knollhaven St
- 2149 Clover St
- 2750 Hollister St
- 2730 Niles St
- 2886 Galena Ave
- 2266 Lansdale Ct
- 2320 Lupin St
- 2146 N Brower St
- 2095 Morley St
- 2466 Royal Ave
- 3045 Galena Ave
- 2391 Heather St
- 2559 Cochran St
- 2346 Royal Ave Unit 9
- 2332 N Justin Ave
- 2357 Lawnview Ct
- 2442 N Alden St
- 3082 Galena Ave