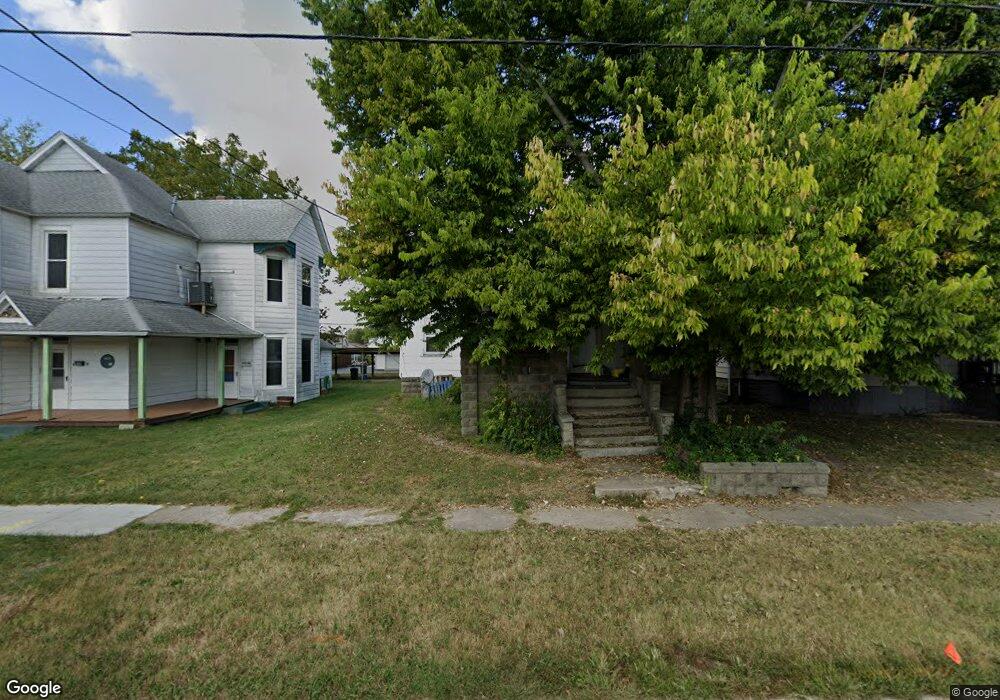
1828 Pine St Murphysboro, IL 62966
Estimated Value: $66,030 - $81,000
Studio
--
Bath
1,571
Sq Ft
$48/Sq Ft
Est. Value
About This Home
This home is located at 1828 Pine St, Murphysboro, IL 62966 and is currently estimated at $74,758, approximately $47 per square foot. 1828 Pine St is a home located in Jackson County with nearby schools including Murphysboro High School, Immanuel Lutheran School, and Murphysboro Christian Academy.
Ownership History
Date
Name
Owned For
Owner Type
Purchase Details
Closed on
Mar 28, 2024
Sold by
Layne Kristine Kay
Bought by
Layne Michael Lance
Current Estimated Value
Purchase Details
Closed on
Feb 3, 2009
Sold by
Bastien Michael and Frey Shelton
Bought by
Layne Michael L and Layne Kristine K
Home Financials for this Owner
Home Financials are based on the most recent Mortgage that was taken out on this home.
Original Mortgage
$27,700
Interest Rate
4%
Purchase Details
Closed on
Mar 19, 2001
Bought by
Layne Michael K
Create a Home Valuation Report for This Property
The Home Valuation Report is an in-depth analysis detailing your home's value as well as a comparison with similar homes in the area
Home Values in the Area
Average Home Value in this Area
Purchase History
| Date | Buyer | Sale Price | Title Company |
|---|---|---|---|
| Layne Michael Lance | -- | None Listed On Document | |
| Layne Michael L | $43,500 | None Available | |
| Layne Michael K | $34,500 | -- |
Source: Public Records
Mortgage History
| Date | Status | Borrower | Loan Amount |
|---|---|---|---|
| Previous Owner | Layne Michael L | $27,700 |
Source: Public Records
Tax History
| Year | Tax Paid | Tax Assessment Tax Assessment Total Assessment is a certain percentage of the fair market value that is determined by local assessors to be the total taxable value of land and additions on the property. | Land | Improvement |
|---|---|---|---|---|
| 2024 | $1,793 | $17,482 | $1,635 | $15,847 |
| 2023 | $1,690 | $15,510 | $1,450 | $14,060 |
| 2022 | $1,609 | $14,216 | $1,329 | $12,887 |
| 2021 | $1,559 | $13,337 | $1,247 | $12,090 |
| 2020 | $1,568 | $13,178 | $1,232 | $11,946 |
| 2019 | $1,452 | $12,949 | $1,211 | $11,738 |
| 2018 | $1,350 | $12,832 | $1,211 | $11,621 |
| 2017 | $1,345 | $12,832 | $1,211 | $11,621 |
| 2016 | $1,313 | $12,832 | $1,211 | $11,621 |
| 2015 | -- | $12,832 | $1,211 | $11,621 |
| 2014 | -- | $9,748 | $1,211 | $8,537 |
| 2012 | -- | $9,666 | $1,344 | $8,322 |
Source: Public Records
Map
Nearby Homes
Your Personal Tour Guide
Ask me questions while you tour the home.