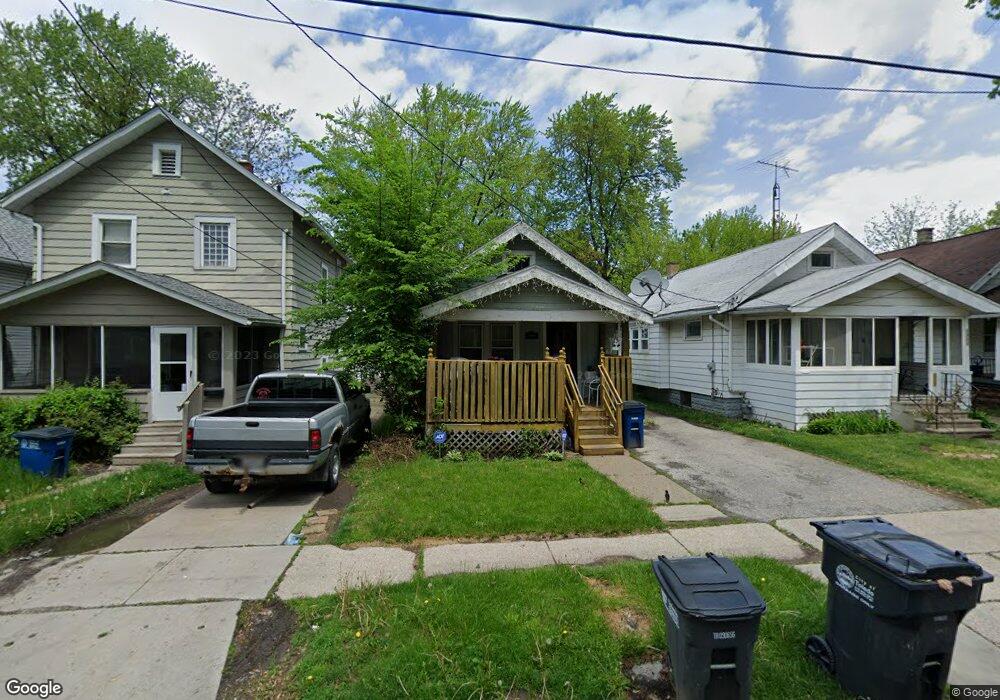
1828 Talbot St Toledo, OH 43613
DeVeaux NeighborhoodEstimated Value: $80,000 - $95,000
3
Beds
2
Baths
1,253
Sq Ft
$67/Sq Ft
Est. Value
About This Home
This home is located at 1828 Talbot St, Toledo, OH 43613 and is currently estimated at $84,423, approximately $67 per square foot. 1828 Talbot St is a home located in Lucas County with nearby schools including DeVeaux Elementary School, Start High School, and Horizon Science Academy - Toledo High School.
Ownership History
Date
Name
Owned For
Owner Type
Purchase Details
Closed on
Dec 11, 2022
Sold by
David Mark and David Marie
Bought by
David Frederick E and David George M
Current Estimated Value
Purchase Details
Closed on
Oct 7, 2014
Sold by
David Alice
Bought by
David Mark and David Marie
Purchase Details
Closed on
Jul 6, 1994
Sold by
Testa Barbara R
Bought by
David Fred
Home Financials for this Owner
Home Financials are based on the most recent Mortgage that was taken out on this home.
Original Mortgage
$26,800
Interest Rate
8.25%
Mortgage Type
New Conventional
Purchase Details
Closed on
Sep 30, 1988
Sold by
Gressman Norman J
Create a Home Valuation Report for This Property
The Home Valuation Report is an in-depth analysis detailing your home's value as well as a comparison with similar homes in the area
Home Values in the Area
Average Home Value in this Area
Purchase History
| Date | Buyer | Sale Price | Title Company |
|---|---|---|---|
| David Frederick E | -- | None Listed On Document | |
| David Mark | -- | None Available | |
| David Fred | $38,500 | -- | |
| -- | $30,000 | -- |
Source: Public Records
Mortgage History
| Date | Status | Borrower | Loan Amount |
|---|---|---|---|
| Previous Owner | David Fred | $26,800 |
Source: Public Records
Tax History Compared to Growth
Tax History
| Year | Tax Paid | Tax Assessment Tax Assessment Total Assessment is a certain percentage of the fair market value that is determined by local assessors to be the total taxable value of land and additions on the property. | Land | Improvement |
|---|---|---|---|---|
| 2024 | $675 | $21,210 | $6,930 | $14,280 |
| 2023 | $1,111 | $17,150 | $3,780 | $13,370 |
| 2022 | $1,113 | $17,150 | $3,780 | $13,370 |
| 2021 | $1,142 | $17,150 | $3,780 | $13,370 |
| 2020 | $1,239 | $16,625 | $3,640 | $12,985 |
| 2019 | $1,209 | $16,625 | $3,640 | $12,985 |
| 2018 | $1,243 | $16,625 | $3,640 | $12,985 |
| 2017 | $1,270 | $16,275 | $3,570 | $12,705 |
| 2016 | $1,268 | $46,500 | $10,200 | $36,300 |
| 2015 | $1,256 | $46,500 | $10,200 | $36,300 |
| 2014 | $1,052 | $16,280 | $3,570 | $12,710 |
| 2013 | $1,052 | $16,280 | $3,570 | $12,710 |
Source: Public Records
Map
Nearby Homes
- 1840 Talbot St
- 1814 Balkan Place
- 1759 Talbot St
- 1846 Balkan Place
- 1815 Berdan Ave
- 1749 Berdan Ave
- 1834 Berdan Ave
- 1935 Talbot St
- 1939 Balkan Place
- 1820 Barrows St
- 1741 Barrows St
- 1818 Barrows St
- 3821 Jackman Rd
- 3430 Upton Ave
- 1929 Marlow Rd
- 2012 Berdan Ave
- 1921 Brussels St
- 1725 Brussels St
- 1822 Wychwood St
- 1952 Fairfax Rd
- 1832 Talbot St
- 1834 Talbot St
- 1822 Talbot St
- 1838 Talbot St
- 1820 Talbot St
- 1816 Talbot St
- 1827 Balkan Place
- 1833 Balkan Place
- 1835 Balkan Place
- 1814 Talbot St
- 1844 Talbot St
- 1821 Balkan Place
- 1841 Balkan Place
- 1829 Talbot St
- 1831 Talbot St
- 1827 Talbot St
- 1815 Balkan Place
- 1846 Talbot St
- 1810 Talbot St
- 1835 Talbot St