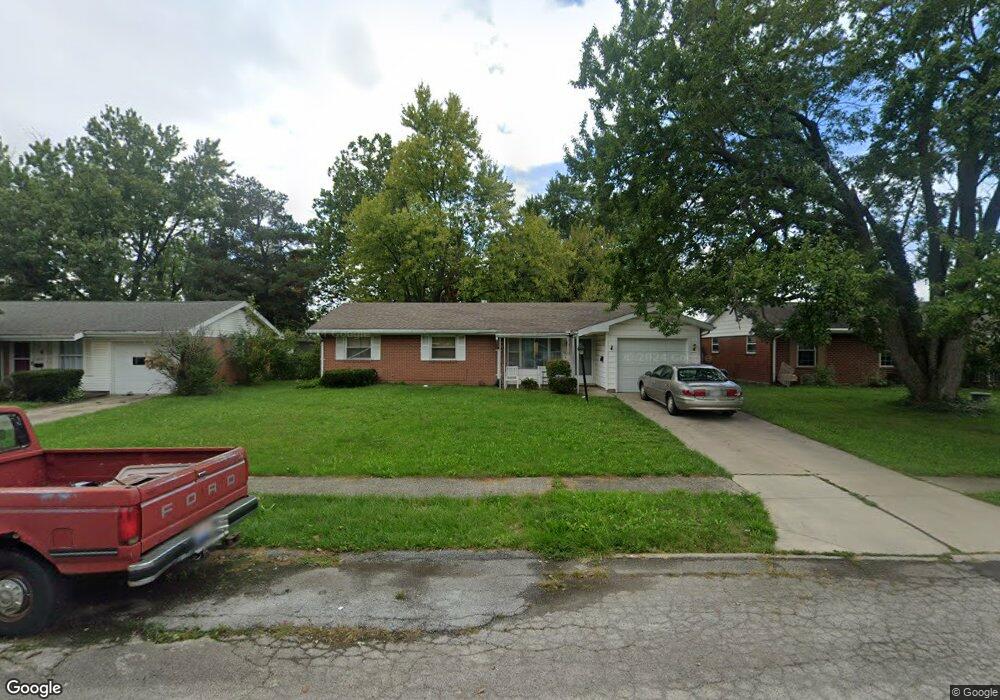
1829 Rice Ave Lima, OH 45805
Westgate NeighborhoodEstimated Value: $146,000 - $173,000
3
Beds
2
Baths
1,221
Sq Ft
$130/Sq Ft
Est. Value
About This Home
This home is located at 1829 Rice Ave, Lima, OH 45805 and is currently estimated at $158,345, approximately $129 per square foot. 1829 Rice Ave is a home located in Allen County with nearby schools including Heritage Elementary School, Lima West Middle School, and Lima North Middle School.
Ownership History
Date
Name
Owned For
Owner Type
Purchase Details
Closed on
Sep 11, 2007
Sold by
Newcomer Carmen L
Bought by
Reynolds Gregory
Current Estimated Value
Home Financials for this Owner
Home Financials are based on the most recent Mortgage that was taken out on this home.
Original Mortgage
$30,000
Outstanding Balance
$5,077
Interest Rate
6.66%
Mortgage Type
Purchase Money Mortgage
Estimated Equity
$153,268
Purchase Details
Closed on
Jan 1, 1990
Bought by
Newcomer Carmen L
Create a Home Valuation Report for This Property
The Home Valuation Report is an in-depth analysis detailing your home's value as well as a comparison with similar homes in the area
Home Values in the Area
Average Home Value in this Area
Purchase History
| Date | Buyer | Sale Price | Title Company |
|---|---|---|---|
| Reynolds Gregory | $75,000 | None Available | |
| Newcomer Carmen L | -- | -- |
Source: Public Records
Mortgage History
| Date | Status | Borrower | Loan Amount |
|---|---|---|---|
| Open | Reynolds Gregory | $30,000 |
Source: Public Records
Tax History
| Year | Tax Paid | Tax Assessment Tax Assessment Total Assessment is a certain percentage of the fair market value that is determined by local assessors to be the total taxable value of land and additions on the property. | Land | Improvement |
|---|---|---|---|---|
| 2024 | $882 | $33,430 | $6,270 | $27,160 |
| 2023 | $669 | $24,220 | $4,550 | $19,670 |
| 2022 | $687 | $24,220 | $4,550 | $19,670 |
| 2021 | $724 | $24,220 | $4,550 | $19,670 |
| 2020 | $633 | $20,580 | $4,340 | $16,240 |
| 2019 | $633 | $20,580 | $4,340 | $16,240 |
| 2018 | $1,019 | $20,580 | $4,340 | $16,240 |
| 2017 | $1,012 | $19,810 | $4,340 | $15,470 |
| 2016 | $1,021 | $19,810 | $4,340 | $15,470 |
| 2015 | $1,002 | $19,810 | $4,340 | $15,470 |
| 2014 | $1,002 | $19,220 | $4,590 | $14,630 |
| 2013 | $975 | $19,220 | $4,590 | $14,630 |
Source: Public Records
Map
Nearby Homes
- 3 Poulston Place
- 705 Cornell Dr
- 1753 Leland Ave
- 1605 Hazel Ave
- 102 Charwood Dr
- 1600 Leland Ave
- 1918 Oakland Pkwy
- 275 N Dale Dr
- 1716 Oakland Pkwy
- 1607 W Wayne St
- 2057 W High St
- 2201 W High St
- 1517 Allentown Rd
- 1407 Latham Ave
- 1541 Oakland Pkwy
- 1508 Oakland Pkwy
- 161 S Cable Rd
- 1245 Latham Ave
- 1641 Whitehall Dr
- 1730 Homeward Ave
Your Personal Tour Guide
Ask me questions while you tour the home.