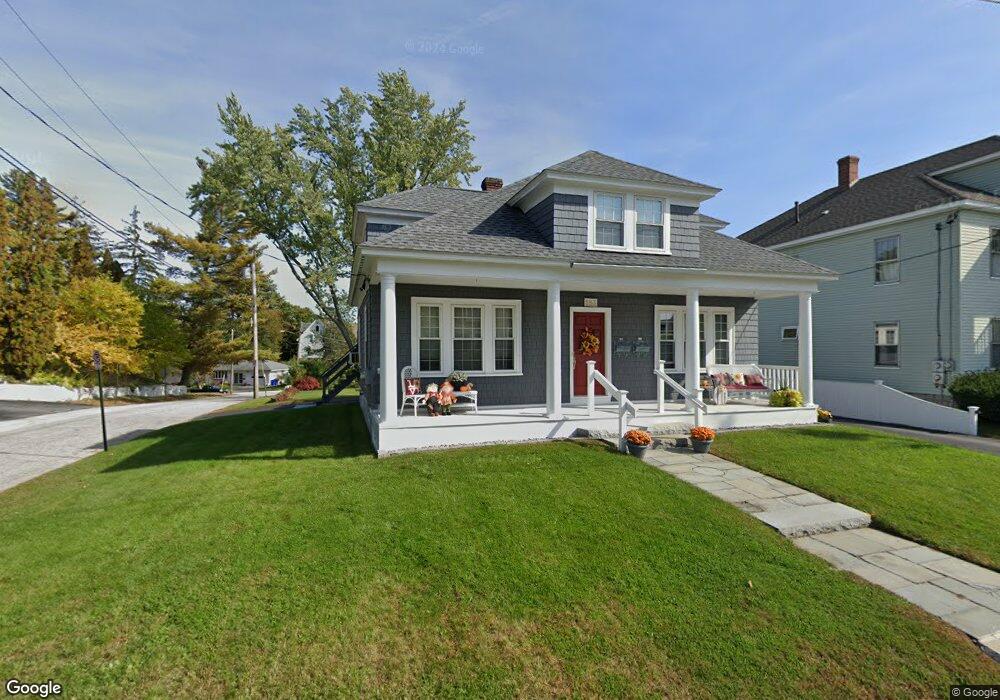
183 Bismark St Unit 2 Manchester, NH 03102
Mast Road NeighborhoodEstimated Value: $407,000 - $497,000
2
Beds
1
Bath
600
Sq Ft
$774/Sq Ft
Est. Value
About This Home
This home is located at 183 Bismark St Unit 2, Manchester, NH 03102 and is currently estimated at $464,601, approximately $774 per square foot. 183 Bismark St Unit 2 is a home located in Hillsborough County with nearby schools including Parker-Varney School, Middle School at Parkside, and Manchester West High School.
Ownership History
Date
Name
Owned For
Owner Type
Purchase Details
Closed on
Jul 27, 2011
Sold by
Basquil James B
Bought by
Houde Gastane C
Current Estimated Value
Purchase Details
Closed on
Sep 28, 2001
Sold by
Basqull James B
Bought by
Basqull James B
Home Financials for this Owner
Home Financials are based on the most recent Mortgage that was taken out on this home.
Original Mortgage
$120,000
Interest Rate
6.91%
Create a Home Valuation Report for This Property
The Home Valuation Report is an in-depth analysis detailing your home's value as well as a comparison with similar homes in the area
Home Values in the Area
Average Home Value in this Area
Purchase History
| Date | Buyer | Sale Price | Title Company |
|---|---|---|---|
| Houde Gastane C | $137,000 | -- | |
| Basqull James B | $20,000 | -- |
Source: Public Records
Mortgage History
| Date | Status | Borrower | Loan Amount |
|---|---|---|---|
| Previous Owner | Basqull James B | $120,000 |
Source: Public Records
Tax History Compared to Growth
Tax History
| Year | Tax Paid | Tax Assessment Tax Assessment Total Assessment is a certain percentage of the fair market value that is determined by local assessors to be the total taxable value of land and additions on the property. | Land | Improvement |
|---|---|---|---|---|
| 2024 | $6,277 | $320,600 | $92,400 | $228,200 |
| 2023 | $6,047 | $320,600 | $92,400 | $228,200 |
| 2022 | $5,848 | $320,600 | $92,400 | $228,200 |
| 2021 | $5,668 | $320,600 | $92,400 | $228,200 |
| 2020 | $4,907 | $199,000 | $63,700 | $135,300 |
| 2019 | $4,840 | $199,000 | $63,700 | $135,300 |
| 2018 | $4,712 | $199,000 | $63,700 | $135,300 |
| 2017 | $4,641 | $199,000 | $63,700 | $135,300 |
| 2016 | $4,605 | $199,000 | $63,700 | $135,300 |
| 2015 | $4,210 | $179,600 | $63,700 | $115,900 |
| 2014 | $4,221 | $179,600 | $63,700 | $115,900 |
| 2013 | $3,965 | $174,900 | $63,700 | $111,200 |
Source: Public Records
Map
Nearby Homes