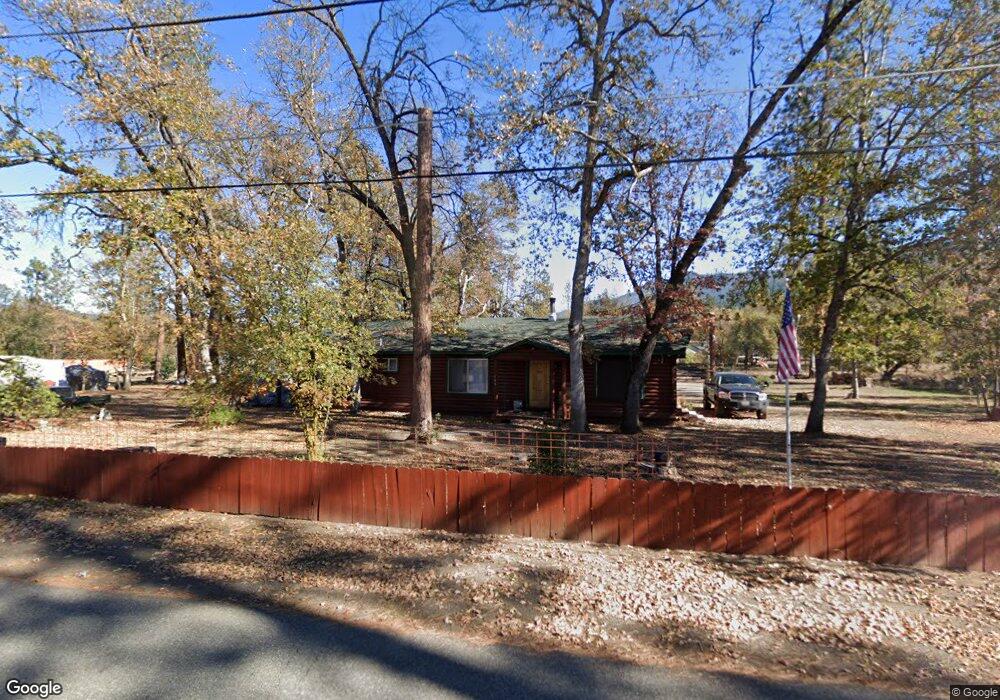
183 Pine Ave Hayfork, CA 96041
Estimated Value: $121,000 - $236,609
Studio
--
Bath
--
Sq Ft
80,586
Sq Ft Lot
About This Home
This home is located at 183 Pine Ave, Hayfork, CA 96041 and is currently estimated at $174,652. 183 Pine Ave is a home with nearby schools including Hayfork High School.
Ownership History
Date
Name
Owned For
Owner Type
Purchase Details
Closed on
Jul 29, 2008
Sold by
Lee C David and Lee Jaclyn
Bought by
Mcdonald G David and Mcdonald Mary T
Current Estimated Value
Home Financials for this Owner
Home Financials are based on the most recent Mortgage that was taken out on this home.
Original Mortgage
$148,800
Interest Rate
6.42%
Mortgage Type
Stand Alone Refi Refinance Of Original Loan
Purchase Details
Closed on
Mar 26, 2008
Sold by
Mcdonald Mary T and Lee Mary T
Bought by
Mcdonald Mary T and Mcdonald David Lee
Home Financials for this Owner
Home Financials are based on the most recent Mortgage that was taken out on this home.
Original Mortgage
$100,000
Interest Rate
6.04%
Mortgage Type
Stand Alone Refi Refinance Of Original Loan
Create a Home Valuation Report for This Property
The Home Valuation Report is an in-depth analysis detailing your home's value as well as a comparison with similar homes in the area
Home Values in the Area
Average Home Value in this Area
Purchase History
| Date | Buyer | Sale Price | Title Company |
|---|---|---|---|
| Mcdonald G David | -- | Orange Coast Title | |
| Mcdonald Mary T | -- | Ticor Title Company |
Source: Public Records
Mortgage History
| Date | Status | Borrower | Loan Amount |
|---|---|---|---|
| Closed | Mcdonald G David | $148,800 | |
| Closed | Mcdonald Mary T | $100,000 |
Source: Public Records
Tax History
| Year | Tax Paid | Tax Assessment Tax Assessment Total Assessment is a certain percentage of the fair market value that is determined by local assessors to be the total taxable value of land and additions on the property. | Land | Improvement |
|---|---|---|---|---|
| 2025 | $1,439 | $126,596 | $33,577 | $93,019 |
| 2024 | $1,419 | $124,115 | $32,919 | $91,196 |
| 2023 | $1,419 | $121,682 | $32,274 | $89,408 |
| 2022 | $1,393 | $119,297 | $31,642 | $87,655 |
| 2021 | $1,293 | $116,959 | $31,022 | $85,937 |
| 2020 | $1,246 | $115,760 | $30,704 | $85,056 |
| 2019 | $1,223 | $113,491 | $30,102 | $83,389 |
| 2018 | $1,190 | $111,266 | $29,512 | $81,754 |
| 2017 | $1,185 | $109,085 | $28,934 | $80,151 |
| 2016 | $1,144 | $106,947 | $28,367 | $78,580 |
| 2015 | $1,128 | $105,341 | $27,941 | $77,400 |
| 2014 | $1,114 | $103,278 | $27,394 | $75,884 |
Source: Public Records
Map
Nearby Homes
Your Personal Tour Guide
Ask me questions while you tour the home.