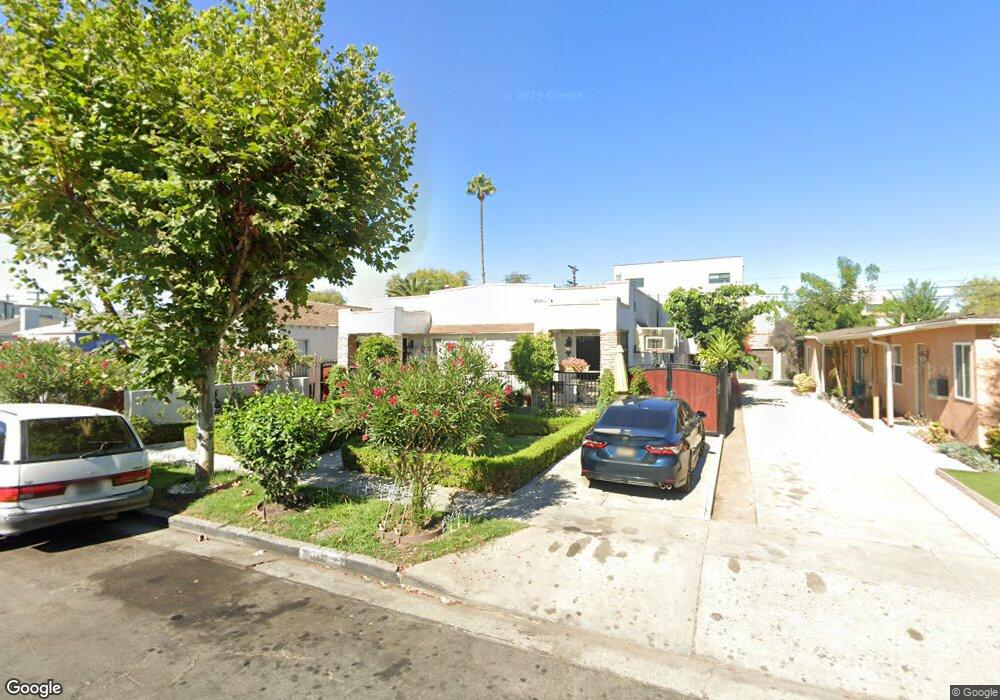
1831 S Sycamore Ave Los Angeles, CA 90019
Mid-City NeighborhoodEstimated Value: $1,115,083 - $1,220,000
2
Beds
2
Baths
1,810
Sq Ft
$643/Sq Ft
Est. Value
About This Home
This home is located at 1831 S Sycamore Ave, Los Angeles, CA 90019 and is currently estimated at $1,163,771, approximately $642 per square foot. 1831 S Sycamore Ave is a home located in Los Angeles County with nearby schools including Saturn Street Elementary School, Los Angeles Senior High School, and Stella Elementary Charter Academy.
Ownership History
Date
Name
Owned For
Owner Type
Purchase Details
Closed on
Oct 24, 1995
Sold by
Hernandez Isreal and Chavez Demetrio
Bought by
Ramos Jose D
Current Estimated Value
Home Financials for this Owner
Home Financials are based on the most recent Mortgage that was taken out on this home.
Original Mortgage
$145,350
Outstanding Balance
$1,019
Interest Rate
7.59%
Estimated Equity
$1,162,752
Purchase Details
Closed on
Jun 2, 1995
Sold by
Federal Home Loan Mortgage Corporation
Bought by
Monroy Carlos
Home Financials for this Owner
Home Financials are based on the most recent Mortgage that was taken out on this home.
Original Mortgage
$72,400
Interest Rate
7.88%
Purchase Details
Closed on
Sep 26, 1994
Sold by
American Svgs Bank Fa
Bought by
Federal Home Loan Mortgage Corporation
Purchase Details
Closed on
Jul 13, 1994
Sold by
N A Mtg Services Inc
Bought by
American Svgs Bank Fa and American Svgs Bank
Create a Home Valuation Report for This Property
The Home Valuation Report is an in-depth analysis detailing your home's value as well as a comparison with similar homes in the area
Home Values in the Area
Average Home Value in this Area
Purchase History
| Date | Buyer | Sale Price | Title Company |
|---|---|---|---|
| Ramos Jose D | $153,000 | Continental Lawyers Title Co | |
| Monroy Carlos | $90,500 | First American Title Co | |
| Federal Home Loan Mortgage Corporation | -- | First American Title | |
| American Svgs Bank Fa | $135,755 | Stewart Title |
Source: Public Records
Mortgage History
| Date | Status | Borrower | Loan Amount |
|---|---|---|---|
| Open | Ramos Jose D | $145,350 | |
| Previous Owner | Monroy Carlos | $72,400 |
Source: Public Records
Tax History Compared to Growth
Tax History
| Year | Tax Paid | Tax Assessment Tax Assessment Total Assessment is a certain percentage of the fair market value that is determined by local assessors to be the total taxable value of land and additions on the property. | Land | Improvement |
|---|---|---|---|---|
| 2025 | $3,363 | $254,144 | $142,855 | $111,289 |
| 2024 | $3,363 | $249,161 | $140,054 | $109,107 |
| 2023 | $3,307 | $244,276 | $137,308 | $106,968 |
| 2022 | $3,167 | $239,487 | $134,616 | $104,871 |
| 2021 | $3,118 | $234,792 | $131,977 | $102,815 |
| 2019 | $3,032 | $228,109 | $128,063 | $100,046 |
| 2018 | $2,915 | $223,642 | $125,552 | $98,090 |
| 2016 | $2,775 | $214,691 | $120,678 | $94,013 |
| 2015 | $2,737 | $211,467 | $118,866 | $92,601 |
| 2014 | $2,761 | $207,326 | $116,538 | $90,788 |
Source: Public Records
Map
Nearby Homes
- 1858 S Orange Dr
- 1820 Alsace Ave
- 1915 1917 S Orange Dr
- 5036 Pickford St
- 1801 S Sycamore Ave
- 1861 S Redondo Blvd
- 5047 W 21st St
- 5154 W 20th St
- 4935 W 20th St
- 1623 S Sycamore Ave
- 5173 Pickford St
- 1851 S Cloverdale Ave
- 2115 S Mansfield Ave
- 5144 W 21st St
- 4901 4905 W 20th St
- 1867 S Cochran Ave
- 5227 W 20th St
- 2116 S Cloverdale Ave
- 1807 Cochran Place
- 1502 S Redondo Blvd
- 1825 S Sycamore Ave
- 1835 S Sycamore Ave
- 1841 S Sycamore Ave
- 1821 S Sycamore Ave Unit 2
- 1821 S Sycamore Ave Unit 1
- 1821 S Sycamore Ave
- 1828 Alsace Ave
- 1819 S Sycamore Ave
- 1834 Alsace Ave
- 1817 S Sycamore Ave
- 1843 S Sycamore Ave
- 1824 Alsace Ave
- 1838 Alsace Ave
- 1828 S Sycamore Ave
- 1832 S Sycamore Ave
- 1842 Alsace Ave
- 1811 S Sycamore Ave
- 1824 S Sycamore Ave
- 1849 S Sycamore Ave
- 1838 S Sycamore Ave