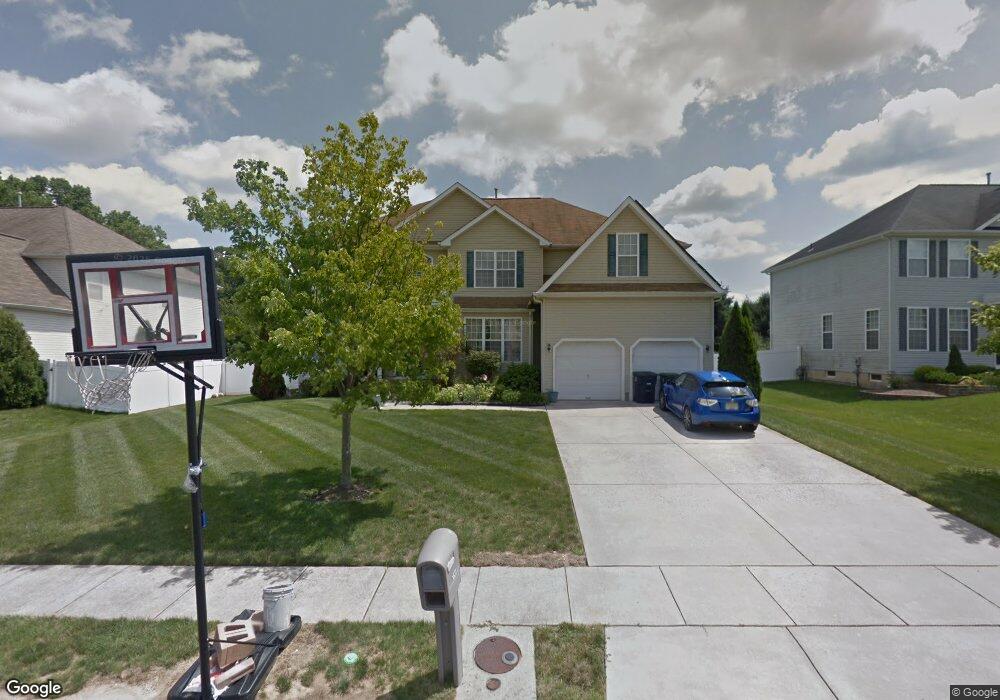
1831 Stallion Ct Williamstown, NJ 08094
Monroe Township Gloucester NeighborhoodEstimated Value: $587,286 - $648,000
--
Bed
--
Bath
3,706
Sq Ft
$171/Sq Ft
Est. Value
About This Home
This home is located at 1831 Stallion Ct, Williamstown, NJ 08094 and is currently estimated at $632,322, approximately $170 per square foot. 1831 Stallion Ct is a home located in Gloucester County with nearby schools including Williamstown High School and Beacon Academy.
Ownership History
Date
Name
Owned For
Owner Type
Purchase Details
Closed on
Oct 28, 2005
Sold by
Nasulme David
Bought by
Surles James and Surles Phoebe
Current Estimated Value
Home Financials for this Owner
Home Financials are based on the most recent Mortgage that was taken out on this home.
Original Mortgage
$320,000
Outstanding Balance
$174,153
Interest Rate
5.93%
Mortgage Type
Fannie Mae Freddie Mac
Estimated Equity
$458,169
Purchase Details
Closed on
Jan 27, 2005
Sold by
Group Ten Builders Inc
Bought by
Nasulme David
Home Financials for this Owner
Home Financials are based on the most recent Mortgage that was taken out on this home.
Original Mortgage
$224,960
Interest Rate
5.73%
Mortgage Type
Purchase Money Mortgage
Purchase Details
Closed on
Aug 25, 2004
Sold by
Ridings Development Llc
Bought by
Group Ten Builders Inc
Create a Home Valuation Report for This Property
The Home Valuation Report is an in-depth analysis detailing your home's value as well as a comparison with similar homes in the area
Home Values in the Area
Average Home Value in this Area
Purchase History
| Date | Buyer | Sale Price | Title Company |
|---|---|---|---|
| Surles James | $400,000 | Chicago Title Insurance Co | |
| Nasulme David | $281,200 | Congress | |
| Group Ten Builders Inc | $875,000 | Congress Title Corp |
Source: Public Records
Mortgage History
| Date | Status | Borrower | Loan Amount |
|---|---|---|---|
| Open | Surles James | $320,000 | |
| Previous Owner | Nasulme David | $224,960 |
Source: Public Records
Tax History Compared to Growth
Tax History
| Year | Tax Paid | Tax Assessment Tax Assessment Total Assessment is a certain percentage of the fair market value that is determined by local assessors to be the total taxable value of land and additions on the property. | Land | Improvement |
|---|---|---|---|---|
| 2025 | $11,766 | $321,300 | $56,200 | $265,100 |
| 2024 | $11,679 | $321,300 | $56,200 | $265,100 |
| 2023 | $11,679 | $321,300 | $56,200 | $265,100 |
| 2022 | $11,625 | $321,300 | $56,200 | $265,100 |
| 2021 | $10,699 | $321,300 | $56,200 | $265,100 |
| 2020 | $11,686 | $321,300 | $56,200 | $265,100 |
| 2019 | $11,615 | $321,300 | $56,200 | $265,100 |
| 2018 | $11,425 | $321,300 | $56,200 | $265,100 |
| 2017 | $11,193 | $316,000 | $68,900 | $247,100 |
| 2016 | $11,051 | $316,000 | $68,900 | $247,100 |
| 2015 | $10,735 | $316,000 | $68,900 | $247,100 |
| 2014 | $10,422 | $316,000 | $68,900 | $247,100 |
Source: Public Records
Map
Nearby Homes
- Cadence Plan at Blaze Mill
- Ballad Plan at Blaze Mill
- Aria Plan at Blaze Mill
- 23 Turnberry Dr
- 7 Augusta Ct
- 2020 Paddock Ln
- 1201 Whispering Woods Dr
- 215 Kippen Dr
- Woodcrest Plan at The Greens
- Greenbrier Plan at The Greens
- 41 Prestwick Ln
- Wedgewood Plan at The Greens
- 40 Prestwick Ln
- 1871 Murray Dr
- 212 Montrose Ln
- 504 Castlebay Dr
- 34 Fisler Dr
- 34 Morgan Dr
- 161 Deschler Blvd
- 0 Pitman Downer Rd
- 1827 Stallion Ct
- 1835 Stallion Ct
- 1823 Stallion Ct
- 1839 Stallion Ct
- 1830 Stallion Ct
- 1822 Stallion Ct
- 1834 Stallion Ct
- 1840 Stallion Ct
- 1814 Stallion Ct
- 1819 Stallion Ct
- 2121 Fries Mill Rd
- 1810 Stallion Ct
- 1815 Stallion Ct
- 1811 Stallion Ct
- 1806 Stallion Ct
- 1809 Stallion Ct
- 1802 Stallion Ct
- 1805 Stallion Ct
- 2115 Fries Mill Rd
- 1801 Stallion Ct