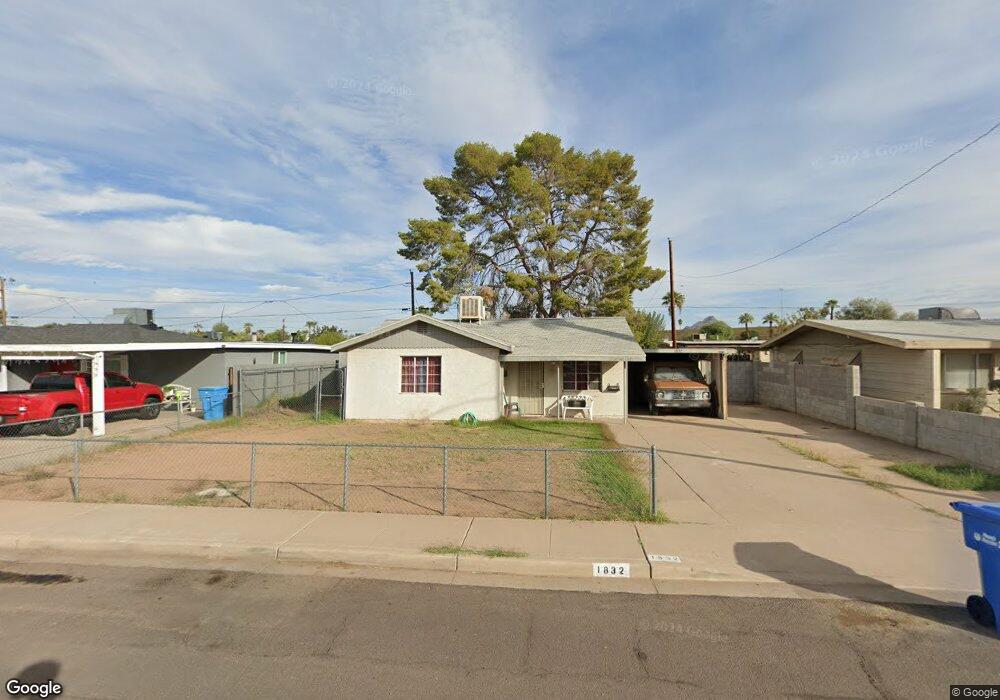
1832 E Cheery Lynn Rd Phoenix, AZ 85016
Central City NeighborhoodEstimated Value: $355,647 - $454,000
Studio
2
Baths
1,187
Sq Ft
$354/Sq Ft
Est. Value
About This Home
This home is located at 1832 E Cheery Lynn Rd, Phoenix, AZ 85016 and is currently estimated at $419,662, approximately $353 per square foot. 1832 E Cheery Lynn Rd is a home located in Maricopa County with nearby schools including Loma Linda Elementary School, North High School, and Phoenix Coding Academy.
Ownership History
Date
Name
Owned For
Owner Type
Purchase Details
Closed on
Apr 13, 1998
Sold by
City Of Phoenix
Bought by
Valenzuela John A
Current Estimated Value
Home Financials for this Owner
Home Financials are based on the most recent Mortgage that was taken out on this home.
Original Mortgage
$63,583
Outstanding Balance
$12,038
Interest Rate
7.07%
Estimated Equity
$407,624
Purchase Details
Closed on
May 16, 1994
Sold by
Moloney Roy E and Moloney Jacqueline F
Bought by
City Of Phoenix
Create a Home Valuation Report for This Property
The Home Valuation Report is an in-depth analysis detailing your home's value as well as a comparison with similar homes in the area
Home Values in the Area
Average Home Value in this Area
Purchase History
| Date | Buyer | Sale Price | Title Company |
|---|---|---|---|
| Valenzuela John A | -- | Nations Title Insurance | |
| City Of Phoenix | -- | Lawyers Title |
Source: Public Records
Mortgage History
| Date | Status | Borrower | Loan Amount |
|---|---|---|---|
| Open | Valenzuela John A | $63,583 |
Source: Public Records
Tax History
| Year | Tax Paid | Tax Assessment Tax Assessment Total Assessment is a certain percentage of the fair market value that is determined by local assessors to be the total taxable value of land and additions on the property. | Land | Improvement |
|---|---|---|---|---|
| 2025 | $810 | $6,785 | -- | -- |
| 2024 | $808 | $6,784 | -- | -- |
| 2023 | $808 | $32,270 | $6,450 | $25,820 |
| 2022 | $774 | $24,720 | $4,940 | $19,780 |
| 2021 | $803 | $21,860 | $4,370 | $17,490 |
| 2020 | $782 | $21,270 | $4,250 | $17,020 |
| 2019 | $778 | $17,950 | $3,590 | $14,360 |
| 2018 | $761 | $17,820 | $3,560 | $14,260 |
| 2017 | $730 | $13,710 | $2,740 | $10,970 |
| 2016 | $700 | $9,070 | $1,810 | $7,260 |
| 2015 | $652 | $7,270 | $1,450 | $5,820 |
Source: Public Records
Map
Nearby Homes
- 1908 E Pinchot Ave Unit 1908 Ea
- 1847 E Pinchot Ave
- 1637 E Earll Dr
- 1636 E Pinchot Ave
- 2038 E Cheery Lynn Rd
- 2022 E Mulberry Dr
- 3023 N 16th St
- 3201 N 21st St
- 1648 E Mitchell Dr
- 2101 E Osborn Rd
- 3141 N 21st Place
- 2002 E Whitton Ave Unit 32
- 1517 E Pinchot Ave
- 2030 E Whitton Ave
- 1550 E Cheery Lynn Rd
- 2208 E Earll Dr
- 1840 E Clarendon Ave
- 1516 E Thomas Rd
- 3502 N 22nd St
- 2023 E Clarendon Ave
- 1828 E Cheery Lynn Rd
- 1831 E Monterey Way
- 1831 E Monterey Way
- 1822 E Cheery Lynn Rd
- 1837 E Monterey Way
- 1837 E Cheery Lynn Rd
- 1831 E Cheery Lynn Rd
- 1839 E Cheery Lynn Rd
- 1827 E Cheery Lynn Rd
- 1818 E Cheery Lynn Rd
- 1843 E Cheery Lynn Rd
- 1821 E Cheery Lynn Rd
- 1817 E Monterey Way
- 1847 E Cheery Lynn Rd
- 1817 E Cheery Lynn Rd
- 1812 E Cheery Lynn Rd
- 1812 E Cheery Lynn Rd Unit n/a
- 1832 E Earll Dr
- 1853 E Monterey Way
- 1832 E Monterey Way
Your Personal Tour Guide
Ask me questions while you tour the home.