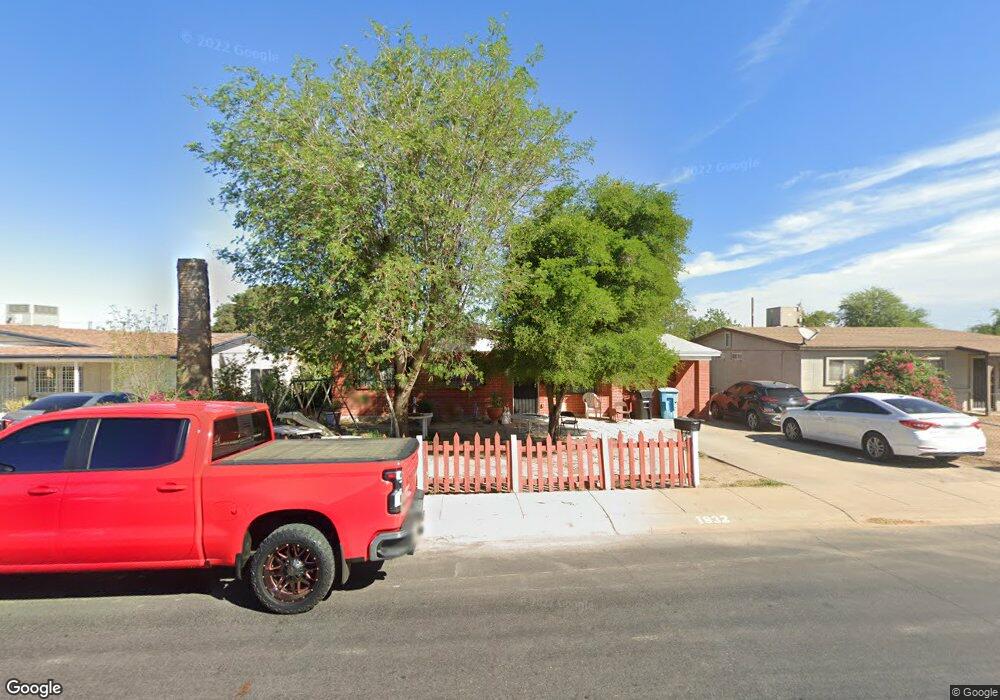
1832 W Wayland Rd Phoenix, AZ 85041
South Mountain NeighborhoodEstimated Value: $352,000 - $453,000
--
Bed
1
Bath
1,480
Sq Ft
$262/Sq Ft
Est. Value
About This Home
This home is located at 1832 W Wayland Rd, Phoenix, AZ 85041 and is currently estimated at $388,000, approximately $262 per square foot. 1832 W Wayland Rd is a home located in Maricopa County with nearby schools including C J Jorgensen School, Cesar Chavez High School, and Phoenix Coding Academy.
Ownership History
Date
Name
Owned For
Owner Type
Purchase Details
Closed on
Aug 16, 2021
Sold by
Bonilla Aurora L
Bought by
Bonilla Aurora L and Martinez Francisco L
Current Estimated Value
Purchase Details
Closed on
Apr 14, 2000
Sold by
Bonilla Aurora L
Bought by
Bonilla Rafael and Bonilla Aurora L
Home Financials for this Owner
Home Financials are based on the most recent Mortgage that was taken out on this home.
Original Mortgage
$45,000
Interest Rate
8.24%
Purchase Details
Closed on
Apr 3, 2000
Sold by
Bonilla Rafael
Bought by
Bonilla Aurora L
Home Financials for this Owner
Home Financials are based on the most recent Mortgage that was taken out on this home.
Original Mortgage
$45,000
Interest Rate
8.24%
Create a Home Valuation Report for This Property
The Home Valuation Report is an in-depth analysis detailing your home's value as well as a comparison with similar homes in the area
Home Values in the Area
Average Home Value in this Area
Purchase History
| Date | Buyer | Sale Price | Title Company |
|---|---|---|---|
| Bonilla Aurora L | -- | None Listed On Document | |
| Bonilla Rafael | -- | Capital Title Agency | |
| Bonilla Aurora L | -- | Capital Title Agency |
Source: Public Records
Mortgage History
| Date | Status | Borrower | Loan Amount |
|---|---|---|---|
| Previous Owner | Bonilla Aurora L | $45,000 |
Source: Public Records
Tax History Compared to Growth
Tax History
| Year | Tax Paid | Tax Assessment Tax Assessment Total Assessment is a certain percentage of the fair market value that is determined by local assessors to be the total taxable value of land and additions on the property. | Land | Improvement |
|---|---|---|---|---|
| 2025 | -- | $2,899 | -- | -- |
| 2024 | -- | -- | -- | -- |
| 2023 | $0 | $4,860 | $970 | $3,890 |
| 2022 | $0 | $4,860 | $970 | $3,890 |
| 2021 | $0 | $14,630 | $2,920 | $11,710 |
| 2020 | $471 | $12,770 | $2,550 | $10,220 |
| 2019 | $220 | $10,960 | $2,190 | $8,770 |
| 2018 | $208 | $4,860 | $970 | $3,890 |
| 2017 | $158 | $4,860 | $970 | $3,890 |
| 2016 | $158 | $4,860 | $970 | $3,890 |
| 2015 | $232 | $4,860 | $970 | $3,890 |
Source: Public Records
Map
Nearby Homes
- 1737 W Pecan Rd
- 2041 W Hidalgo Ave
- 2054 W Chambers St
- 2011 W Hasan Dr
- 5926 S 16th Dr
- 2048 W Pecan Rd
- 1550 W Southern Ave Unit 20
- 1917 W Burgess Ln
- 2211 W Pecan Rd
- 1616 W Burgess Ln
- 5309 S 16th Dr
- 6510 S 18th Ln
- 2113 W Nancy Ln
- 1832 W Lydia Ln
- 1824 W Lydia Ln
- 5001 S 19th Dr
- 1819 W Chipman Rd
- 2007 W Chipman Rd
- 5911 S 23rd Dr
- 1312 W Sunland Ave
- 1828 W Wayland Rd
- 1838 W Wayland Rd
- 1831 W Pecan Rd
- 1822 W Wayland Rd
- 1827 W Pecan Rd
- 1837 W Pecan Rd
- 1831 W Wayland Rd
- 1837 W Wayland Rd
- 1827 W Wayland Rd
- 1821 W Pecan Rd
- 1818 W Wayland Rd
- 1821 W Wayland Rd
- 1817 W Pecan Rd
- 1817 W Wayland Rd
- 1812 W Wayland Rd
- 1832 W Hidalgo Ave
- 1811 W Pecan Rd
- 1838 W Hidalgo Ave
- 1828 W Hidalgo Ave
- 1832 W Pecan Rd