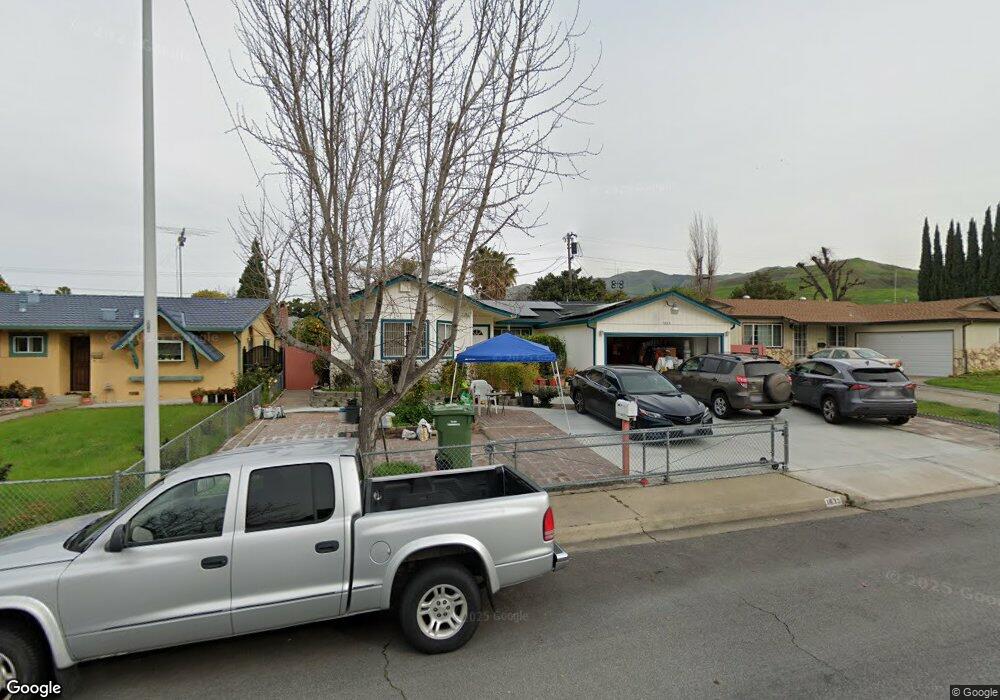
1833 Ellwell Dr Milpitas, CA 95035
Estimated Value: $1,440,000 - $1,843,000
4
Beds
2
Baths
1,777
Sq Ft
$941/Sq Ft
Est. Value
About This Home
This home is located at 1833 Ellwell Dr, Milpitas, CA 95035 and is currently estimated at $1,671,448, approximately $940 per square foot. 1833 Ellwell Dr is a home located in Santa Clara County with nearby schools including Alexander Rose Elementary School, Rancho Milpitas Middle School, and Milpitas High School.
Ownership History
Date
Name
Owned For
Owner Type
Purchase Details
Closed on
Mar 27, 2019
Sold by
Huynh Hien and Duong Nancy Nga
Bought by
Huynh Hien and Duong Nancy Nga
Current Estimated Value
Purchase Details
Closed on
Oct 19, 1998
Sold by
Hien Huynh and Nga Duong
Bought by
Huynh Hien and Duong Nancy Nga
Home Financials for this Owner
Home Financials are based on the most recent Mortgage that was taken out on this home.
Original Mortgage
$135,000
Interest Rate
6.71%
Purchase Details
Closed on
Apr 28, 1995
Sold by
Liu Lannie and Liu Tien Fu
Bought by
Huynh Hien and Duong Nga
Home Financials for this Owner
Home Financials are based on the most recent Mortgage that was taken out on this home.
Original Mortgage
$170,000
Interest Rate
8.44%
Purchase Details
Closed on
Sep 1, 1993
Sold by
Liu Lannie and Liu Tien Fu
Bought by
Liu Lannie and Liu Tien Fu
Home Financials for this Owner
Home Financials are based on the most recent Mortgage that was taken out on this home.
Original Mortgage
$178,500
Interest Rate
6.85%
Create a Home Valuation Report for This Property
The Home Valuation Report is an in-depth analysis detailing your home's value as well as a comparison with similar homes in the area
Home Values in the Area
Average Home Value in this Area
Purchase History
| Date | Buyer | Sale Price | Title Company |
|---|---|---|---|
| Huynh Hien | -- | None Available | |
| Huynh Hien | -- | Fidelity National Title Co | |
| Huynh Hien | $220,000 | Chicago Title Company | |
| Liu Lannie | -- | Old Republic Title Company |
Source: Public Records
Mortgage History
| Date | Status | Borrower | Loan Amount |
|---|---|---|---|
| Closed | Huynh Hien | $135,000 | |
| Closed | Huynh Hien | $170,000 | |
| Previous Owner | Liu Lannie | $178,500 |
Source: Public Records
Tax History Compared to Growth
Tax History
| Year | Tax Paid | Tax Assessment Tax Assessment Total Assessment is a certain percentage of the fair market value that is determined by local assessors to be the total taxable value of land and additions on the property. | Land | Improvement |
|---|---|---|---|---|
| 2025 | $4,331 | $369,506 | $147,799 | $221,707 |
| 2024 | $4,331 | $362,261 | $144,901 | $217,360 |
| 2023 | $4,315 | $355,159 | $142,060 | $213,099 |
| 2022 | $4,299 | $348,196 | $139,275 | $208,921 |
| 2021 | $4,235 | $341,370 | $136,545 | $204,825 |
| 2020 | $4,162 | $337,870 | $135,145 | $202,725 |
| 2019 | $4,116 | $331,246 | $132,496 | $198,750 |
| 2018 | $3,913 | $324,752 | $129,899 | $194,853 |
| 2017 | $3,862 | $318,385 | $127,352 | $191,033 |
| 2016 | $3,703 | $312,143 | $124,855 | $187,288 |
| 2015 | $3,665 | $307,455 | $122,980 | $184,475 |
| 2014 | $3,556 | $301,433 | $120,571 | $180,862 |
Source: Public Records
Map
Nearby Homes
- 2113 Uridias Ranch Rd
- 17 Terfidia Ln
- 1501 Canton Dr
- 1449 Mercury Ct
- 340 Carnegie Dr
- 255 Fanyon St
- 559 Bayview Park Dr
- 496 Dempsey Rd Unit 199
- 1394 Glacier Dr
- 484 Dempsey Rd Unit 185
- 1209 Glacier Dr
- 1195 Acadia Ave
- 1536 Sonoma Dr
- 1612 Tahoe Dr
- 800 Los Positos Dr
- 3352 Landess Ave Unit D
- 1710 Clear Lake Ave
- 3544 Madrid Dr
- 685 Parvin Dr
- 1084 N Hillview Dr
- 1845 Ellwell Dr
- 1821 Ellwell Dr
- 1840 Burley Dr
- 1824 Burley Dr
- 1857 Ellwell Dr
- 1809 Ellwell Dr
- 1856 Burley Dr
- 1836 Ellwell Dr
- 1810 Burley Dr
- 1848 Ellwell Dr
- 1824 Ellwell Dr
- 1870 Burley Dr
- 1795 Ellwell Dr
- 1869 Ellwell Dr
- 1860 Ellwell Dr
- 1812 Ellwell Dr
- 1798 Burley Dr
- 1882 Burley Dr
- 1872 Ellwell Dr
- 1798 Ellwell Dr