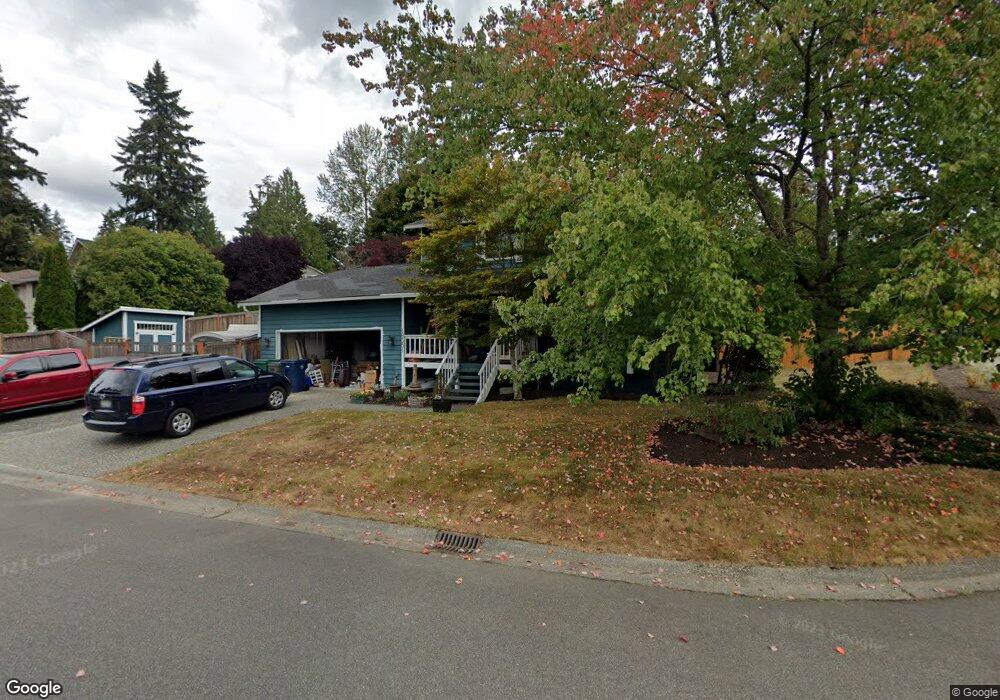
18331 23rd Dr SE Bothell, WA 98012
North Creek NeighborhoodEstimated Value: $844,767 - $899,000
4
Beds
3
Baths
1,722
Sq Ft
$503/Sq Ft
Est. Value
About This Home
This home is located at 18331 23rd Dr SE, Bothell, WA 98012 and is currently estimated at $866,442, approximately $503 per square foot. 18331 23rd Dr SE is a home located in Snohomish County with nearby schools including Crystal Springs Elementary School, Skyview Middle School, and North Creek High School.
Ownership History
Date
Name
Owned For
Owner Type
Purchase Details
Closed on
Jan 26, 2006
Sold by
Sheppard Christopher A and Sheppard Lorinda S
Bought by
Davis Dennis and Davis Apryl J
Current Estimated Value
Home Financials for this Owner
Home Financials are based on the most recent Mortgage that was taken out on this home.
Original Mortgage
$345,267
Outstanding Balance
$187,737
Interest Rate
6.21%
Mortgage Type
VA
Estimated Equity
$678,705
Purchase Details
Closed on
Jan 15, 2001
Sold by
Buettner Steven R and Collier Buettner Marjorie Ann
Bought by
Sheppard Christopher A and Sheppard Lorinda S
Home Financials for this Owner
Home Financials are based on the most recent Mortgage that was taken out on this home.
Original Mortgage
$181,600
Interest Rate
7.54%
Create a Home Valuation Report for This Property
The Home Valuation Report is an in-depth analysis detailing your home's value as well as a comparison with similar homes in the area
Home Values in the Area
Average Home Value in this Area
Purchase History
| Date | Buyer | Sale Price | Title Company |
|---|---|---|---|
| Davis Dennis | $338,000 | Old Republic Title Ltd | |
| Sheppard Christopher A | $227,000 | -- |
Source: Public Records
Mortgage History
| Date | Status | Borrower | Loan Amount |
|---|---|---|---|
| Open | Davis Dennis | $345,267 | |
| Previous Owner | Sheppard Christopher A | $181,600 | |
| Closed | Sheppard Christopher A | $34,050 |
Source: Public Records
Tax History
| Year | Tax Paid | Tax Assessment Tax Assessment Total Assessment is a certain percentage of the fair market value that is determined by local assessors to be the total taxable value of land and additions on the property. | Land | Improvement |
|---|---|---|---|---|
| 2026 | $7,560 | $947,600 | $691,000 | $256,600 |
| 2025 | $7,006 | $840,100 | $590,000 | $250,100 |
| 2024 | $7,006 | $778,400 | $537,000 | $241,400 |
| 2023 | $8,234 | $1,023,100 | $755,000 | $268,100 |
| 2022 | $7,070 | $697,600 | $470,000 | $227,600 |
| 2020 | $6,120 | $569,000 | $369,000 | $200,000 |
| 2019 | $5,460 | $513,000 | $315,000 | $198,000 |
| 2018 | $5,053 | $441,700 | $265,000 | $176,700 |
| 2017 | $4,293 | $381,200 | $215,000 | $166,200 |
| 2016 | $3,840 | $331,900 | $180,000 | $151,900 |
| 2015 | $3,805 | $312,400 | $170,000 | $142,400 |
| 2013 | $3,593 | $262,600 | $145,000 | $117,600 |
Source: Public Records
Map
Nearby Homes
- 2401 185th Place SE
- 18429 20th Dr SE
- 18309 26th Dr SE
- 18501 28th Ave SE
- 18632 29th Ave SE
- 18809 20th Dr SE
- 3028 183rd Place SE
- 18223 31st Ave SE
- 19102 20th Dr SE Unit B204
- 19102 20th Dr SE Unit B202
- 19102 20th Dr SE Unit B206
- 17529 Brook Blvd
- 18910 Bothell Everett Hwy Unit H2
- 18910 Bothell Everett Hwy Unit N2
- 19218 26th Ave SE Unit 117
- 3205 179th Place SE
- 18930 Bothell Everett Hwy Unit B-103
- 18930 Bothell Everett Hwy Unit G103
- 18930 Bothell Everett Hwy Unit G105
- 3125 194th St SE
- 2315 184th Place SE
- 18332 23rd Dr SE
- 2321 184th Place SE
- 18411 23rd Dr SE
- 18328 23rd Dr SE
- 18327 23rd Dr SE
- 18410 23rd Dr SE
- 18329 23rd Dr SE
- 18321 23rd Dr SE
- 2327 184th Place SE
- 2233 184th Place SE
- 2314 184th Place SE
- 18322 23rd Dr SE
- 18415 23rd Dr SE
- 18317 23rd Dr SE
- 2232 184th Place SE
- 18316 23rd Dr SE
- 18414 23rd Dr SE
- 2326 184th Place SE
- 2405 184th Place SE
Your Personal Tour Guide
Ask me questions while you tour the home.