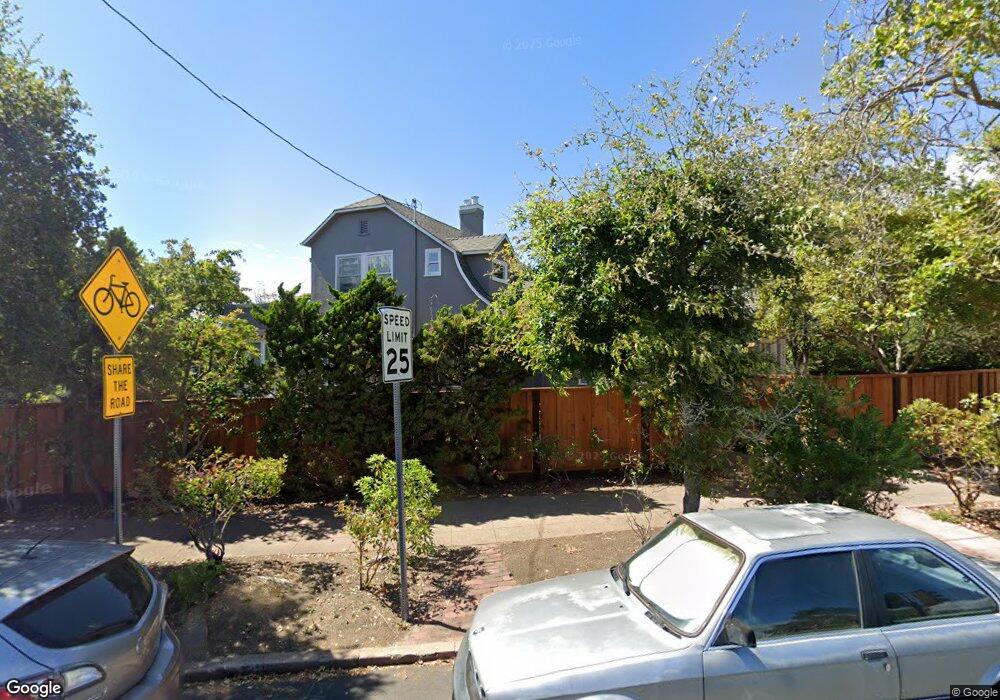
1835 Monterey Ave Berkeley, CA 94707
Northbrae NeighborhoodEstimated Value: $1,952,000 - $2,153,000
3
Beds
3
Baths
2,228
Sq Ft
$927/Sq Ft
Est. Value
About This Home
This home is located at 1835 Monterey Ave, Berkeley, CA 94707 and is currently estimated at $2,064,667, approximately $926 per square foot. 1835 Monterey Ave is a home located in Alameda County with nearby schools including Thousand Oaks Elementary School, Ruth Acty Elementary, and Berkeley Arts Magnet at Whittier School.
Ownership History
Date
Name
Owned For
Owner Type
Purchase Details
Closed on
Dec 13, 2010
Sold by
Coleman Gordon C and Coleman Family Living Trust
Bought by
Coleman Gordon C and Gordon C Coleman Survivors Tru
Current Estimated Value
Purchase Details
Closed on
Oct 21, 2004
Sold by
Coleman Gordon C and Coleman Cela B
Bought by
Coleman Gordon C and Coleman Cela B
Purchase Details
Closed on
Jun 9, 2004
Sold by
Coleman Gordon C and Coleman Cela B
Bought by
Coleman Gordon C and Coleman Cela B
Home Financials for this Owner
Home Financials are based on the most recent Mortgage that was taken out on this home.
Original Mortgage
$164,000
Interest Rate
6.29%
Mortgage Type
New Conventional
Purchase Details
Closed on
Jul 22, 1994
Sold by
Coleman Gordon C and Coleman Cela B
Bought by
Coleman Gordon C and Coleman Cela B
Create a Home Valuation Report for This Property
The Home Valuation Report is an in-depth analysis detailing your home's value as well as a comparison with similar homes in the area
Home Values in the Area
Average Home Value in this Area
Purchase History
| Date | Buyer | Sale Price | Title Company |
|---|---|---|---|
| Coleman Gordon C | -- | None Available | |
| Coleman Gordon C | -- | -- | |
| Coleman Gordon C | -- | Financial Title Company | |
| Coleman Gordon C | -- | -- | |
| Coleman Gordon C | -- | -- |
Source: Public Records
Mortgage History
| Date | Status | Borrower | Loan Amount |
|---|---|---|---|
| Previous Owner | Coleman Gordon C | $164,000 |
Source: Public Records
Tax History
| Year | Tax Paid | Tax Assessment Tax Assessment Total Assessment is a certain percentage of the fair market value that is determined by local assessors to be the total taxable value of land and additions on the property. | Land | Improvement |
|---|---|---|---|---|
| 2025 | $18,239 | $1,064,968 | $343,942 | $728,026 |
| 2024 | $18,239 | $1,043,951 | $337,199 | $713,752 |
| 2023 | $7,179 | $150,701 | $66,691 | $84,010 |
| 2022 | $6,878 | $140,747 | $65,384 | $82,363 |
| 2021 | $6,821 | $137,850 | $64,102 | $80,748 |
| 2020 | $6,207 | $143,365 | $63,444 | $79,921 |
| 2019 | $5,684 | $140,555 | $62,201 | $78,354 |
| 2018 | $5,772 | $131,198 | $60,981 | $70,217 |
| 2017 | $4,415 | $98,234 | $59,786 | $38,448 |
| 2016 | $4,096 | $96,308 | $58,613 | $37,695 |
| 2015 | $4,006 | $94,861 | $57,733 | $37,128 |
| 2014 | $3,851 | $93,003 | $56,602 | $36,401 |
Source: Public Records
Map
Nearby Homes
- 1015 Merced St
- 1960 El Dorado Ave
- 1809 Hopkins St
- 1923 Yolo Ave
- 1546 Beverly Place
- 1983 Yosemite Rd
- 826 Indian Rock Ave
- 2012 Rose St
- 1425 Martin Luther King jr Way
- 770 Santa Barbara Rd
- 1360 Acton St
- 1328 Marin Ave
- 1444 Walnut St
- 1038 Pomona Ave
- 1563 Thousand Oaks Blvd
- 1127 Key Route Blvd
- 1609 Bonita Ave Unit 3
- 1609 Bonita Ave Unit 5
- 600 San Luis Rd
- 1610 Milvia St
- 1012 The Alameda
- 1008 The Alameda
- 1017 Fresno Ave
- 1825 Monterey Ave
- 1015 Fresno Ave
- 1100 The Alameda
- 1004 The Alameda
- 1011 Fresno Ave
- 1834 Monterey Ave
- 1000 The Alameda
- 1828 Marin Ave
- 1110 The Alameda
- 1824 Marin Ave
- 1830 Monterey Ave
- 1819 Monterey Ave
- 1103 The Alameda
- 1105 The Alameda
- 1101 The Alameda
- 1824 Monterey Ave
Your Personal Tour Guide
Ask me questions while you tour the home.