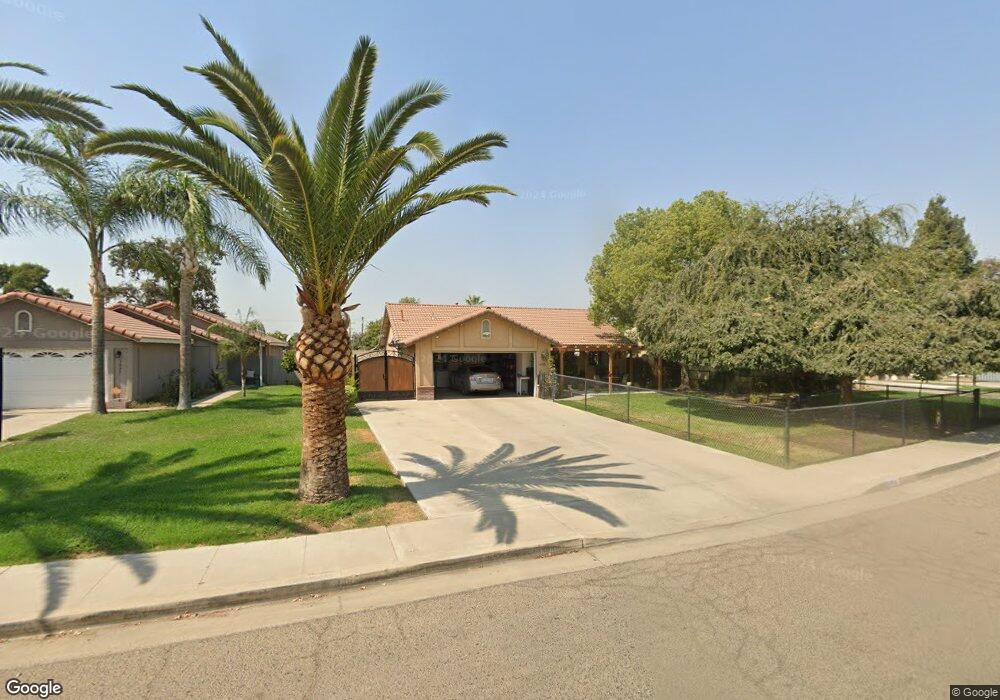
1835 N Tipton St Visalia, CA 93292
North Visalia NeighborhoodEstimated Value: $319,000 - $359,000
3
Beds
2
Baths
1,240
Sq Ft
$271/Sq Ft
Est. Value
About This Home
This home is located at 1835 N Tipton St, Visalia, CA 93292 and is currently estimated at $335,879, approximately $270 per square foot. 1835 N Tipton St is a home located in Tulare County with nearby schools including Four Creeks Elementary School, Valley Oak Middle School, and Golden West High School.
Ownership History
Date
Name
Owned For
Owner Type
Purchase Details
Closed on
Jun 15, 2022
Sold by
Acosta Aida
Bought by
Acosta Aida and Vega Gregorio
Current Estimated Value
Home Financials for this Owner
Home Financials are based on the most recent Mortgage that was taken out on this home.
Original Mortgage
$427,500
Outstanding Balance
$221,579
Interest Rate
3%
Mortgage Type
Reverse Mortgage Home Equity Conversion Mortgage
Estimated Equity
$114,300
Purchase Details
Closed on
Jul 21, 2003
Sold by
Acosta Tomas Torres
Bought by
Acosta Aida
Home Financials for this Owner
Home Financials are based on the most recent Mortgage that was taken out on this home.
Original Mortgage
$96,000
Interest Rate
7.24%
Mortgage Type
Purchase Money Mortgage
Purchase Details
Closed on
Sep 28, 1998
Sold by
Visalians Interested In Affordable Housi
Bought by
Acosta Tomas T and Acosta Leiza M
Home Financials for this Owner
Home Financials are based on the most recent Mortgage that was taken out on this home.
Original Mortgage
$70,552
Interest Rate
6.73%
Create a Home Valuation Report for This Property
The Home Valuation Report is an in-depth analysis detailing your home's value as well as a comparison with similar homes in the area
Home Values in the Area
Average Home Value in this Area
Purchase History
| Date | Buyer | Sale Price | Title Company |
|---|---|---|---|
| Acosta Aida | -- | New Title Company Name | |
| Acosta Aida | $120,000 | Fidelity National Title Co | |
| Acosta Tomas Torres | -- | Fidelity National Title Co | |
| Acosta Tomas T | $85,000 | Chicago Title Co |
Source: Public Records
Mortgage History
| Date | Status | Borrower | Loan Amount |
|---|---|---|---|
| Open | Acosta Aida | $427,500 | |
| Closed | Acosta Aida | $427,500 | |
| Previous Owner | Acosta Aida | $96,000 | |
| Previous Owner | Acosta Tomas T | $70,552 | |
| Closed | Acosta Tomas T | $15,000 | |
| Closed | Acosta Aida | $18,000 |
Source: Public Records
Tax History Compared to Growth
Tax History
| Year | Tax Paid | Tax Assessment Tax Assessment Total Assessment is a certain percentage of the fair market value that is determined by local assessors to be the total taxable value of land and additions on the property. | Land | Improvement |
|---|---|---|---|---|
| 2025 | $2,104 | $262,204 | $61,122 | $201,082 |
| 2024 | $2,104 | $186,399 | $41,816 | $144,583 |
| 2023 | $2,050 | $182,746 | $40,997 | $141,749 |
| 2022 | $1,964 | $179,164 | $40,194 | $138,970 |
| 2021 | $1,965 | $175,651 | $39,406 | $136,245 |
| 2020 | $1,948 | $173,850 | $39,002 | $134,848 |
| 2019 | $1,897 | $170,441 | $38,237 | $132,204 |
| 2018 | $1,839 | $167,099 | $37,487 | $129,612 |
| 2017 | $1,782 | $161,000 | $40,000 | $121,000 |
| 2016 | $1,654 | $149,000 | $37,000 | $112,000 |
| 2015 | $1,574 | $154,261 | $35,000 | $119,261 |
| 2014 | $1,609 | $143,965 | $33,000 | $110,965 |
Source: Public Records
Map
Nearby Homes
- 1633 N Tipton St
- 841 E Prospect Ave
- 219 E Elowin Ct
- 203 E Harold Ct
- 625 E Ferguson Ave
- 339 NE 4th Ave
- 312 NE 4th Ave
- 223 W Buena Vista Ave
- 636 E Roosevelt Ave
- 1432 N Locust St
- 128 W Houston Ave
- 1540 N Encina St
- 2218 N Oakhurst St
- 1145 E Ferguson Ave
- 1146 E Buena Vista Ave
- 2241 N Edison St
- 2420 N Michael St
- 2419 N Clark St
- 1205 E Ferguson Ave
- 125 N Hicks St Unit A
- 1847 N Tipton St
- 1827 N Tipton St
- 1905 N Tipton St
- 1819 N Tipton St
- 1819 N Tipton St
- 1811 N Tipton St
- 1915 N Tipton St
- 1834 N Tipton St
- 1848 N Tipton St
- 1809 N Tipton St
- 1809 N Tipton St
- 1824 N Tipton St
- 1906 N Tipton St
- 1747 N Tipton St
- 1925 N Tipton St
- 440 E Buena Vista Ave
- 440 E Buena Vista Ave
- 1745 N Tipton St
- 1918 N Tipton St
- 1748 N Tipton St