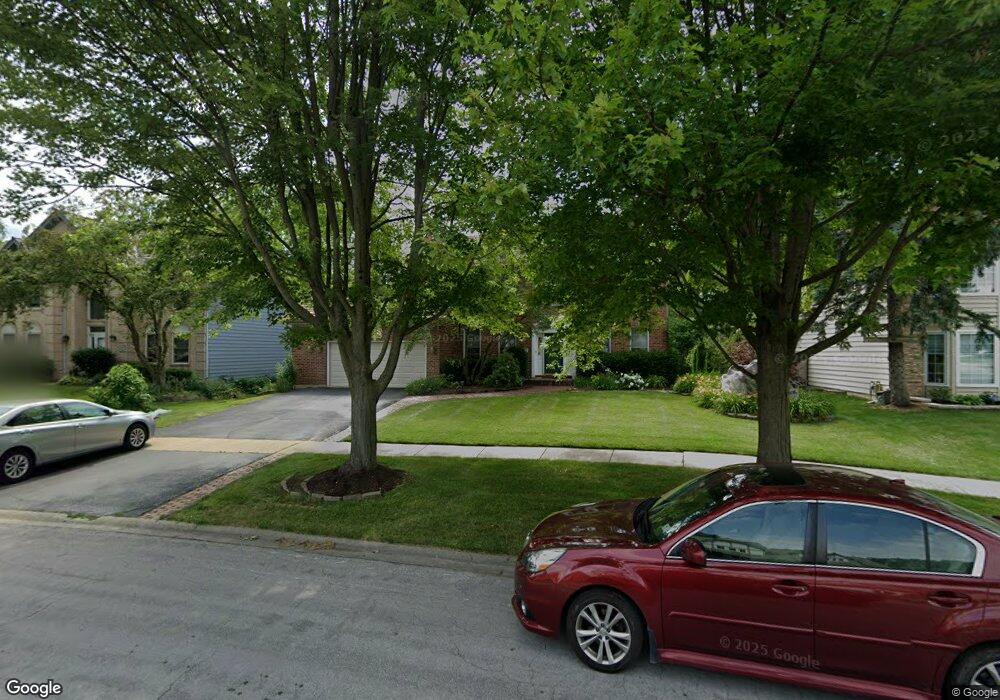
1835 River Ridge Cir Naperville, IL 60565
Meadow Glens NeighborhoodEstimated Value: $831,000 - $904,498
--
Bed
1
Bath
3,212
Sq Ft
$275/Sq Ft
Est. Value
About This Home
This home is located at 1835 River Ridge Cir, Naperville, IL 60565 and is currently estimated at $883,375, approximately $275 per square foot. 1835 River Ridge Cir is a home located in DuPage County with nearby schools including Scott Elementary School, Madison Jr High School, and Naperville Central High School.
Ownership History
Date
Name
Owned For
Owner Type
Purchase Details
Closed on
Jul 26, 2019
Sold by
Koh Teng Thue and Ng Jenny Y
Bought by
Koh Bernard T and Ng Jenny Y
Current Estimated Value
Purchase Details
Closed on
Dec 9, 1998
Sold by
Cappiello Joseph L and Cappiello Theresa A
Bought by
Koh Teng Thue and Ng Jenny Y
Home Financials for this Owner
Home Financials are based on the most recent Mortgage that was taken out on this home.
Original Mortgage
$340,800
Outstanding Balance
$77,746
Interest Rate
6.83%
Estimated Equity
$805,629
Purchase Details
Closed on
Nov 28, 1994
Sold by
Livin Georgeson Emmy and Livin Emmy Georgeson Revocable
Bought by
Cappiello Joseph L and Cappiello Theresa A
Home Financials for this Owner
Home Financials are based on the most recent Mortgage that was taken out on this home.
Original Mortgage
$321,750
Interest Rate
8.91%
Create a Home Valuation Report for This Property
The Home Valuation Report is an in-depth analysis detailing your home's value as well as a comparison with similar homes in the area
Home Values in the Area
Average Home Value in this Area
Purchase History
| Date | Buyer | Sale Price | Title Company |
|---|---|---|---|
| Koh Bernard T | -- | None Available | |
| Koh Teng Thue | $426,000 | -- | |
| Cappiello Joseph L | $357,500 | Land Title Group Inc |
Source: Public Records
Mortgage History
| Date | Status | Borrower | Loan Amount |
|---|---|---|---|
| Open | Koh Teng Thue | $340,800 | |
| Previous Owner | Cappiello Joseph L | $321,750 |
Source: Public Records
Tax History Compared to Growth
Tax History
| Year | Tax Paid | Tax Assessment Tax Assessment Total Assessment is a certain percentage of the fair market value that is determined by local assessors to be the total taxable value of land and additions on the property. | Land | Improvement |
|---|---|---|---|---|
| 2024 | $15,311 | $257,938 | $89,124 | $168,814 |
| 2023 | $14,777 | $235,410 | $81,340 | $154,070 |
| 2022 | $13,985 | $222,090 | $76,740 | $145,350 |
| 2021 | $13,481 | $213,690 | $73,840 | $139,850 |
| 2020 | $13,197 | $209,850 | $72,510 | $137,340 |
| 2019 | $12,820 | $200,770 | $69,370 | $131,400 |
| 2018 | $12,824 | $200,770 | $69,370 | $131,400 |
| 2017 | $12,572 | $194,000 | $67,030 | $126,970 |
| 2016 | $12,328 | $186,990 | $64,610 | $122,380 |
| 2015 | $12,261 | $176,090 | $60,840 | $115,250 |
| 2014 | $12,660 | $176,090 | $60,840 | $115,250 |
| 2013 | $12,470 | $176,520 | $60,990 | $115,530 |
Source: Public Records
Map
Nearby Homes
- 1751 S Washington St Unit 1
- 138 E Bailey Rd Unit M
- 158 E Bailey Rd Unit F
- 128 E Bailey Rd Unit G
- 517 Sheffield Rd
- 621 Bourbon Ct
- 302 Carriage Hill Rd
- 1921 Wisteria Ct Unit 3
- 336 Brooklea Ct
- 23 Glencoe Ct Unit 202B
- 47 Glencoe Ct Unit 102D
- 1449 Whitespire Ct Unit 5104
- 2132 Berkley Ct Unit 201A
- 1408 Swallow St
- 805 Potomac Ave
- 2279 Kaskaskia Ct
- 221 Hampshire Ct Unit 201D
- 213 Winding Creek Dr
- 2280 Barth Dr
- 8S452 Bell Dr
- 1839 River Ridge Cir
- 1831 River Ridge Cir
- 1825 River Ridge Cir
- 1832 River Ridge Cir
- 1843 River Ridge Cir
- 1838 River Ridge Cir
- 1820 River Ridge Cir
- 1842 River Ridge Cir
- 1847 River Ridge Cir
- 1823 River Ridge Cir
- 1848 River Ridge Cir
- 1812 River Ridge Cir
- 375 River Ridge Ct
- 1851 River Ridge Cir
- 1819 River Ridge Cir
- 379 River Ridge Ct
- 1854 River Ridge Cir
- 1815 River Ridge Cir
- 347 Great Oak Ct
- 1806 River Ridge Cir