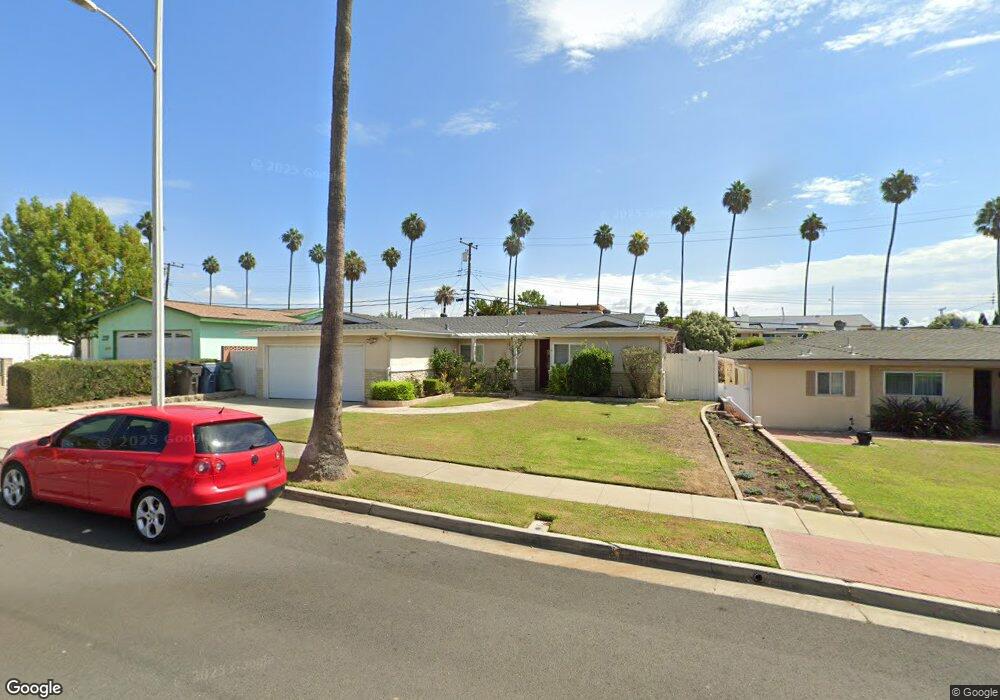
18352 Manitoba Ln Huntington Beach, CA 92648
Estimated Value: $1,158,384 - $1,224,000
4
Beds
2
Baths
1,272
Sq Ft
$940/Sq Ft
Est. Value
About This Home
This home is located at 18352 Manitoba Ln, Huntington Beach, CA 92648 and is currently estimated at $1,195,346, approximately $939 per square foot. 18352 Manitoba Ln is a home located in Orange County with nearby schools including Hope View Elementary School, Mesa View Middle School, and Ocean View High.
Ownership History
Date
Name
Owned For
Owner Type
Purchase Details
Closed on
Oct 5, 2004
Sold by
Welsh Ian O
Bought by
Welsh Ian and Welsh Monica
Current Estimated Value
Purchase Details
Closed on
Feb 26, 1997
Sold by
Welsh Monica Padilla
Bought by
Welsh Ian O
Home Financials for this Owner
Home Financials are based on the most recent Mortgage that was taken out on this home.
Original Mortgage
$140,650
Outstanding Balance
$16,332
Interest Rate
7.86%
Mortgage Type
Seller Take Back
Estimated Equity
$1,179,014
Purchase Details
Closed on
Feb 10, 1997
Sold by
Federal National Mortgage Association
Bought by
Welsh Ian O
Home Financials for this Owner
Home Financials are based on the most recent Mortgage that was taken out on this home.
Original Mortgage
$140,650
Outstanding Balance
$16,332
Interest Rate
7.86%
Mortgage Type
Seller Take Back
Estimated Equity
$1,179,014
Purchase Details
Closed on
Nov 7, 1996
Sold by
Brandon Reed and Brandon Margaret
Bought by
Federal National Mortgage Association
Create a Home Valuation Report for This Property
The Home Valuation Report is an in-depth analysis detailing your home's value as well as a comparison with similar homes in the area
Home Values in the Area
Average Home Value in this Area
Purchase History
| Date | Buyer | Sale Price | Title Company |
|---|---|---|---|
| Welsh Ian | -- | -- | |
| Welsh Ian O | -- | -- | |
| Welsh Ian O | $145,000 | -- | |
| Federal National Mortgage Association | $182,602 | Continental Lawyers Title Co |
Source: Public Records
Mortgage History
| Date | Status | Borrower | Loan Amount |
|---|---|---|---|
| Open | Welsh Ian O | $140,650 |
Source: Public Records
Tax History Compared to Growth
Tax History
| Year | Tax Paid | Tax Assessment Tax Assessment Total Assessment is a certain percentage of the fair market value that is determined by local assessors to be the total taxable value of land and additions on the property. | Land | Improvement |
|---|---|---|---|---|
| 2025 | $3,452 | $285,008 | $207,205 | $77,803 |
| 2024 | $3,452 | $279,420 | $203,142 | $76,278 |
| 2023 | $3,371 | $273,942 | $199,159 | $74,783 |
| 2022 | $3,319 | $268,571 | $195,254 | $73,317 |
| 2021 | $3,260 | $263,305 | $191,425 | $71,880 |
| 2020 | $3,223 | $260,606 | $189,463 | $71,143 |
| 2019 | $3,171 | $255,497 | $185,748 | $69,749 |
| 2018 | $3,102 | $250,488 | $182,106 | $68,382 |
| 2017 | $3,054 | $245,577 | $178,535 | $67,042 |
| 2016 | $2,934 | $240,762 | $175,034 | $65,728 |
| 2015 | $2,889 | $237,146 | $172,405 | $64,741 |
| 2014 | $2,833 | $232,501 | $169,028 | $63,473 |
Source: Public Records
Map
Nearby Homes
- 7702 Alberta Dr
- 18272 Parkview Ln Unit 101
- 18232 Parkview Ln Unit 103
- 7827 Orchid Dr
- 7667 Whitewater Dr
- 18441 Patterson Ln
- 7841 Essex Dr Unit 201
- 18507 Pueblo Cir
- 18702 Demion Ln
- 18712 Demion Ln
- 18101 Wharton Ln
- 18900 Delaware St Unit 48
- 18900 Delaware St Unit 352
- 7831 Shaffer Cir
- 18859 Milos Cir
- 7802 Newman Ave
- 18555 Vallarta Dr
- 18871 Kithira Cir
- 18911 Florida St
- 18785 Heavenwood Cir Unit C171
- 18342 Manitoba Ln
- 18362 Manitoba Ln
- 18351 Delaware St
- 18341 Delaware St
- 18322 Manitoba Ln
- 18372 Manitoba Ln
- 18321 Delaware St
- 18371 Delaware St
- 7711 Quebec Dr
- 7712 Quebec Dr
- 18312 Manitoba Ln
- 18382 Manitoba Ln
- 18381 Delaware St
- 18311 Delaware St
- 7701 Quebec Dr
- 7712 Ontario Dr
- 18392 Manitoba Ln
- 7711 Alberta Dr
- 18391 Delaware St
- 18342 Delaware St