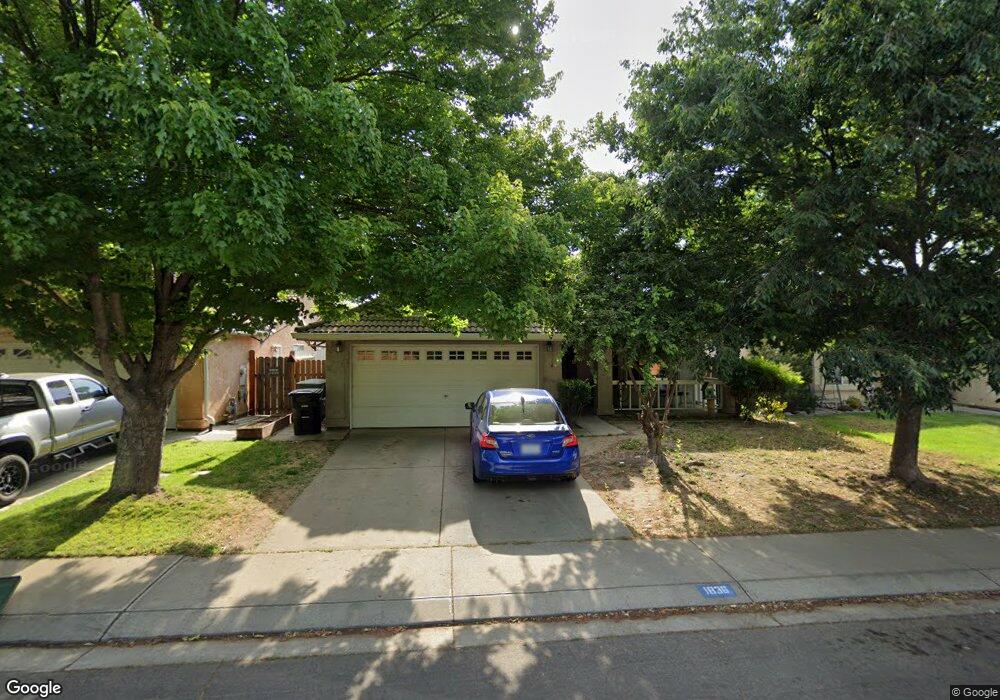
1836 Brahms Way Modesto, CA 95358
Estimated Value: $471,437 - $592,000
4
Beds
2
Baths
1,631
Sq Ft
$322/Sq Ft
Est. Value
About This Home
This home is located at 1836 Brahms Way, Modesto, CA 95358 and is currently estimated at $525,609, approximately $322 per square foot. 1836 Brahms Way is a home located in Stanislaus County with nearby schools including Hart-Ransom Elementary School, Modesto High School, and Connecting Waters Charter School - Central Valley.
Ownership History
Date
Name
Owned For
Owner Type
Purchase Details
Closed on
Dec 27, 2010
Sold by
Tupaz January
Bought by
Wang Halyan and Wang Cunmin
Current Estimated Value
Home Financials for this Owner
Home Financials are based on the most recent Mortgage that was taken out on this home.
Original Mortgage
$104,437
Outstanding Balance
$68,928
Interest Rate
4.43%
Mortgage Type
New Conventional
Estimated Equity
$456,681
Purchase Details
Closed on
Sep 8, 2004
Sold by
Peraino William
Bought by
Tupaz January
Home Financials for this Owner
Home Financials are based on the most recent Mortgage that was taken out on this home.
Original Mortgage
$236,000
Interest Rate
5.32%
Mortgage Type
Purchase Money Mortgage
Purchase Details
Closed on
Nov 25, 1996
Sold by
Lowe Development Company
Bought by
Peraino William
Create a Home Valuation Report for This Property
The Home Valuation Report is an in-depth analysis detailing your home's value as well as a comparison with similar homes in the area
Purchase History
| Date | Buyer | Sale Price | Title Company |
|---|---|---|---|
| Wang Halyan | $139,500 | Chicago Title Company | |
| Tupaz January | $295,000 | Chicago Title | |
| Peraino William | $125,000 | North American Title Co |
Source: Public Records
Mortgage History
| Date | Status | Borrower | Loan Amount |
|---|---|---|---|
| Open | Wang Halyan | $104,437 | |
| Previous Owner | Tupaz January | $236,000 | |
| Closed | Tupaz January | $59,000 |
Source: Public Records
Tax History
| Year | Tax Paid | Tax Assessment Tax Assessment Total Assessment is a certain percentage of the fair market value that is determined by local assessors to be the total taxable value of land and additions on the property. | Land | Improvement |
|---|---|---|---|---|
| 2025 | $1,995 | $178,391 | $51,240 | $127,151 |
| 2024 | $1,960 | $174,894 | $50,236 | $124,658 |
| 2023 | $1,917 | $171,465 | $49,251 | $122,214 |
| 2022 | $1,839 | $168,104 | $48,286 | $119,818 |
| 2021 | $1,805 | $164,809 | $47,340 | $117,469 |
| 2020 | $1,777 | $163,120 | $46,855 | $116,265 |
| 2019 | $1,745 | $159,923 | $45,937 | $113,986 |
| 2018 | $1,717 | $156,788 | $45,037 | $111,751 |
| 2017 | $1,667 | $153,714 | $44,154 | $109,560 |
| 2016 | $1,653 | $150,701 | $43,289 | $107,412 |
| 2015 | $1,584 | $148,438 | $42,639 | $105,799 |
| 2014 | $1,555 | $145,531 | $41,804 | $103,727 |
Source: Public Records
Map
Nearby Homes
- 2701 Mozart Dr
- 2713 Amadeus Dr
- 1604 January Dr
- 1521 January Dr
- 2425 Becker Ct
- 2101 Bridger Dr
- 2624 Woodland Ave
- 1412 Seneca Place
- 1101 Winchell Way
- 2134 Whitcomb Way
- 2820 Finlandia Ave
- 1131 N Rosemore Ave
- 2116 Mount Vernon Dr Unit C
- 2165 Sharon Way
- 1205 Courtney Way
- 2312 St James Place
- 2104 Sharon Way
- 2212 Palisade Ave
- 808 Mercy Ave
- 1200 N Carpenter Rd Unit 146
- 1840 Brahms Way
- 1832 Brahms Way
- 1828 Brahms Way
- 1837 Poust Rd
- 1833 Poust Rd
- 1844 Brahms Way
- 1841 Poust Rd
- 1829 Poust Rd
- 2601 Amadeus Dr
- 2604 Mozart Dr
- 1824 Brahms Way
- 1845 Poust Rd
- 1825 Poust Rd
- 2608 Mozart Dr
- 1820 Brahms Way
- 2605 Amadeus Dr
- 1821 Poust Rd
- 2612 Mozart Dr
- 2517 Mozart Dr
- 2513 Mozart Dr
Your Personal Tour Guide
Ask me questions while you tour the home.